

208
J. A. KITCHING AND F. J. EBLINU
IU
n
J
J
>
0
m
U
Id
J
LL.
z
I n
J
J
TIDES IN LOUGH.
0 1
2
3 4 5 6 7 8 9 1011 12 I3
TIME. I N HOURS.
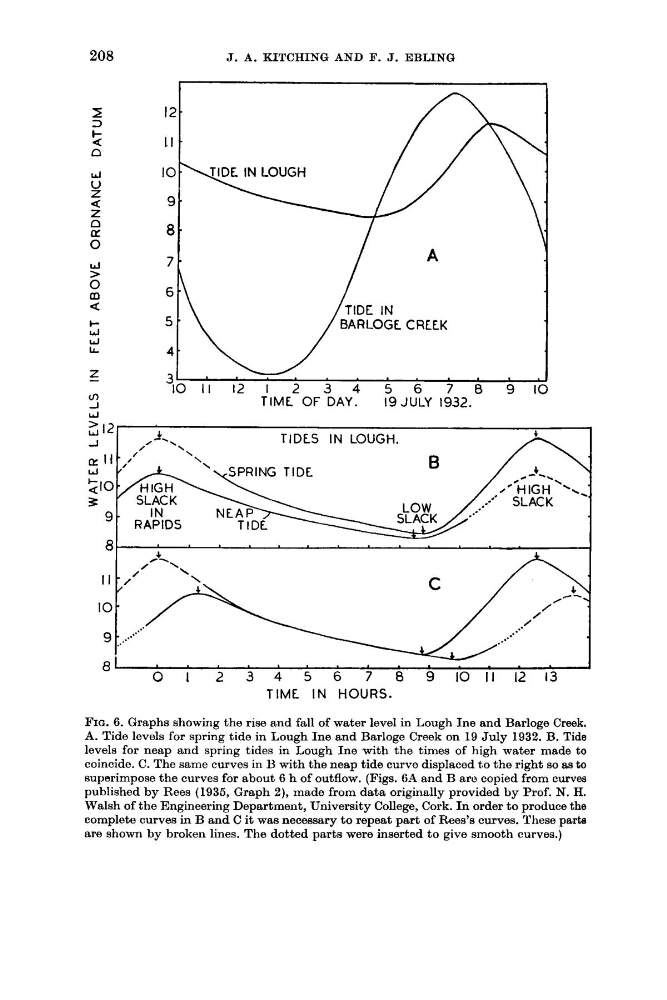
FIG. 6. Graphs showing the rise and fall of water level in Lough Ine and Barloge Creek.
A. Tide levels for spring tide in Lough Ine and Barloge Creek on 19 July 1932. B. Tide
levels for neap and spring tides in Lough Ine with the times of high water made to
coincide. C. The same curves in B with the neap tide curve displaced to the right so as t o
superimpose the curves for about 6 h of outflow. (Figs. 6A and B are copied from curves
published by Roes (1936, Graph 2), made from data originally provided by Prof. N. H.
Walsh of the Engineering Department, University College, Cork. In order t o produce the
complete curves in B and C it was necessary to repeat part of Rees’s curves. These parts
are shown by broken lines. The dotted parts were inserted to give smooth curves.)
J. A. KITCHING AND F. J. EBLINU
IU
n
J
J
>
0
m
U
Id
J
LL.
z
I n
J
J
TIDES IN LOUGH.
0 1
2
3 4 5 6 7 8 9 1011 12 I3
TIME. I N HOURS.
FIG. 6. Graphs showing the rise and fall of water level in Lough Ine and Barloge Creek.
A. Tide levels for spring tide in Lough Ine and Barloge Creek on 19 July 1932. B. Tide
levels for neap and spring tides in Lough Ine with the times of high water made to
coincide. C. The same curves in B with the neap tide curve displaced to the right so as t o
superimpose the curves for about 6 h of outflow. (Figs. 6A and B are copied from curves
published by Roes (1936, Graph 2), made from data originally provided by Prof. N. H.
Walsh of the Engineering Department, University College, Cork. In order t o produce the
complete curves in B and C it was necessary to repeat part of Rees’s curves. These parts
are shown by broken lines. The dotted parts were inserted to give smooth curves.)