

298
H . KLOMP
what factors do cause the pronounced density changes. This can be
demonstrated by Fig. 27.
The steep fall in larval density from 1951 to 1952 is due to an extremely high egg and juvenile mortality in 1952, and a consequent
low population up to the egg stage 1953 inclusive. This story is approximately repeated from 1956 to 1957, inducing the low egg density of
1968.
A very steep rise of egg density occurs from 1953 to 1954 and, albeit
less pronounced, from 1958 to 1959. In both cases this increase of density is induced by high survival in the egg and juvenile larval stages
(see also Figs. 31 and 34).
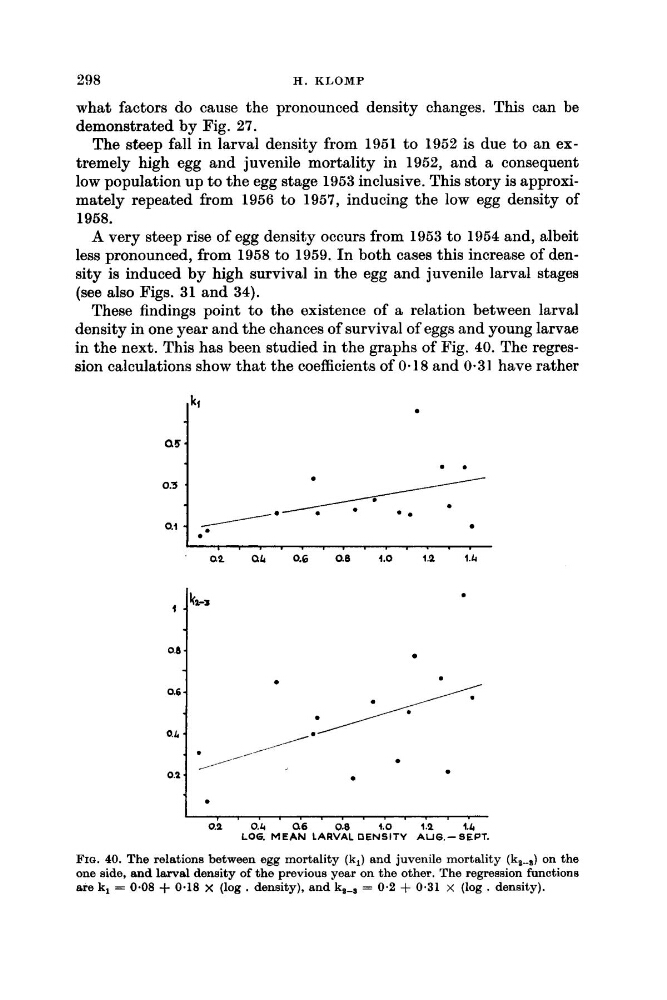
These findings point to the existence of a relation between larval
density in one year and the chances of survival of eggs and young larvae
in the next. This has been studied in the graphs of Fig. 40. The regression calculations show that the coefficients of 0-18 and 0.31 have rather
. . . . . . . . . . - . .
a2
a h
0.6
ae
4.0
1.2
1.h
.
. . .
. . . . .
0.h
0.4
Q.6 ' 68
4.0
1.2
4.k
LOG. M E A N LARVAL DENSITY AUG.-SEPT.
FIQ. 40. The relations between egg mortality (k,) and juvenile mortality (kZ+) on the
one side, and larval density of the previous year on the other. The regression functions
are k, = 0.08 + 0.18 X (log. density), and k2-$ = 0.2 + 0.31 x (log. density).
H . KLOMP
what factors do cause the pronounced density changes. This can be
demonstrated by Fig. 27.
The steep fall in larval density from 1951 to 1952 is due to an extremely high egg and juvenile mortality in 1952, and a consequent
low population up to the egg stage 1953 inclusive. This story is approximately repeated from 1956 to 1957, inducing the low egg density of
1968.
A very steep rise of egg density occurs from 1953 to 1954 and, albeit
less pronounced, from 1958 to 1959. In both cases this increase of density is induced by high survival in the egg and juvenile larval stages
(see also Figs. 31 and 34).
These findings point to the existence of a relation between larval
density in one year and the chances of survival of eggs and young larvae
in the next. This has been studied in the graphs of Fig. 40. The regression calculations show that the coefficients of 0-18 and 0.31 have rather
. . . . . . . . . . - . .
a2
a h
0.6
ae
4.0
1.2
1.h
.
. . .
. . . . .
0.h
0.4
Q.6 ' 68
4.0
1.2
4.k
LOG. M E A N LARVAL DENSITY AUG.-SEPT.
FIQ. 40. The relations between egg mortality (k,) and juvenile mortality (kZ+) on the
one side, and larval density of the previous year on the other. The regression functions
are k, = 0.08 + 0.18 X (log. density), and k2-$ = 0.2 + 0.31 x (log. density).