

292
H . K L O M P
h-r.
0.5 I.>,
0
0
05
I
1.5
LOG L s
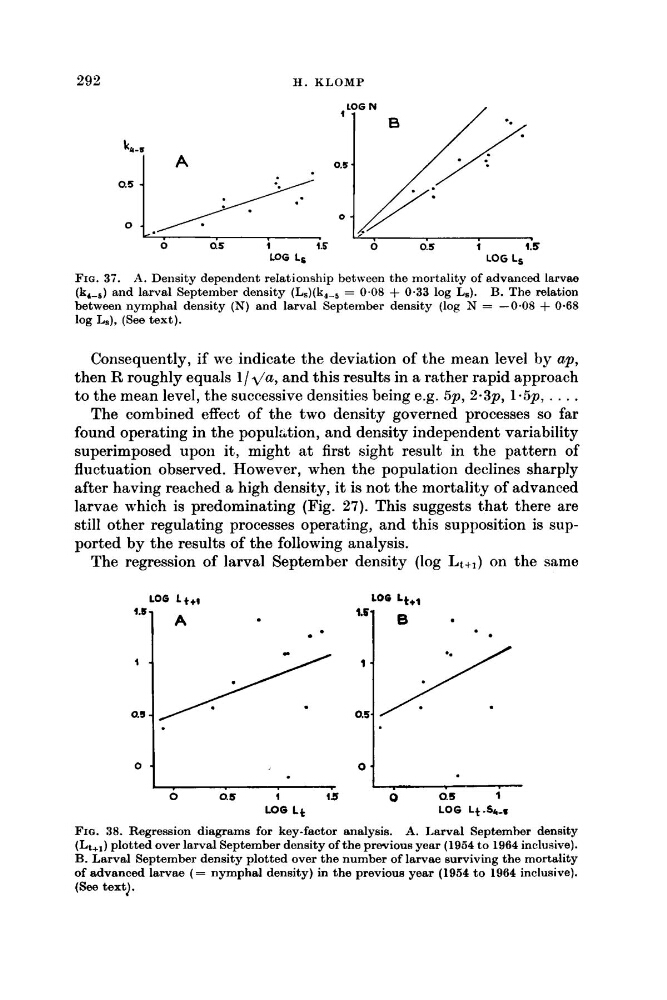
FIG. 3 i . A. Density dependent relationship between the mortality of advanced larvas
(k,--6) and larval September density (Ls)(k4-5 = 0.08 + 0.33 log Ls). €3. The relation
between nymphal density (N) and larval September density (log N = -0.08 + 0-68
log L*), (See text).
Consequently, if we indicate the deviation of the mean level by ap,
then R roughly equals 11 .\/a, and this results in a rather rapid approach
to the mean level, the successive densities being e.g. 5p, 2.3p, 1*5p, . . . .
The combined effect of the two density governed processes so far
found operating in the populrtion, and density independent variability
superimposed upon it, might at first sight result in the pattern of
fluctuation observed. However, when the population declines sharply
after having reached a high density, it is not the mortality of advanced
larvae which is predominating (Fig. 27). This suggests that there are
still other regulating processes operating, and this supposition is supported by the results of the following analysis.
The regression of larval September density (log Lt,,) on the same
I .
. .
0
0.5
1
1 5
LOG L t
FIQ. 38. Regression diagrams for key-factor analysis. A. Larval September density
(Lt,,) plotted over larval September density of the previous year (1954 to 1964 inclusive).
B. Larval September density plotted over the number of larvae surviving the mortality
of advanced larvae ( = nymphal density) i n the previous year (1954 to 1964 inclusive).
(See text).
H . K L O M P
h-r.
0.5 I.>,
0
0
05
I
1.5
LOG L s
FIG. 3 i . A. Density dependent relationship between the mortality of advanced larvas
(k,--6) and larval September density (Ls)(k4-5 = 0.08 + 0.33 log Ls). €3. The relation
between nymphal density (N) and larval September density (log N = -0.08 + 0-68
log L*), (See text).
Consequently, if we indicate the deviation of the mean level by ap,
then R roughly equals 11 .\/a, and this results in a rather rapid approach
to the mean level, the successive densities being e.g. 5p, 2.3p, 1*5p, . . . .
The combined effect of the two density governed processes so far
found operating in the populrtion, and density independent variability
superimposed upon it, might at first sight result in the pattern of
fluctuation observed. However, when the population declines sharply
after having reached a high density, it is not the mortality of advanced
larvae which is predominating (Fig. 27). This suggests that there are
still other regulating processes operating, and this supposition is supported by the results of the following analysis.
The regression of larval September density (log Lt,,) on the same
I .
. .
0
0.5
1
1 5
LOG L t
FIQ. 38. Regression diagrams for key-factor analysis. A. Larval September density
(Lt,,) plotted over larval September density of the previous year (1954 to 1964 inclusive).
B. Larval September density plotted over the number of larvae surviving the mortality
of advanced larvae ( = nymphal density) i n the previous year (1954 to 1964 inclusive).
(See text).