

DYNAMICS OF FIELD POPULATION O F P I N E LOOPER
281
To provide linearity and to stabilize variance, both the densities and the survival rates are converted to logarithms (Morris, 1963b). In the analysis applied
in this study the age interval mortalities and accordingly the survival rates are
combined in the same groups as the k-values in Table XXIV.
The contribution of Et to the size of Et+l is studied bj' plotting log Ettl over
log Et (Fig. 33-A), and then the regression function
log Et+i = b, log Et + I o ~ ( s , . s2 . . . . . . ~ 1 2
. F)
can be computed, and the coefficients of regression (b,) m d correlation (r,) can
be determined.
The contribution of the mortality fluctuations in the egg stage to the annual
changes of egg density ran be analysed by plotting log Et+l over log (Et . s,),
from which the regression function
log Et+i = b, log(Et. 81) + log(s2. 6 3 . . . . . . 91,. F)
can be computed, and the coefficients b, and r1 can be determined (Fig. 33-B).
by the regression
Similarly, the contribution of the mortality in the larval stage can be analyeed
log Et+i = bl-6 log(Et . S, . S, . . . . . . s6) + 1 0 g ( ~ , . . . s,, . F)
giving b1-# and rl-& (Fig. 33-C), and so forth.
The values plotted can be derived quite simply from the life tables, because in
fact they all represent densities given in Table XXIII, column I ) . Thus
(Et . s1 . sz . . . . . . sa) is the number of individuals surviving the larval stage,
being 1-2 pupae in 1959/60, and the value plotted for this year in Fig. 33-C is
log 1.2 = 0.08 (see also Table XXIV).
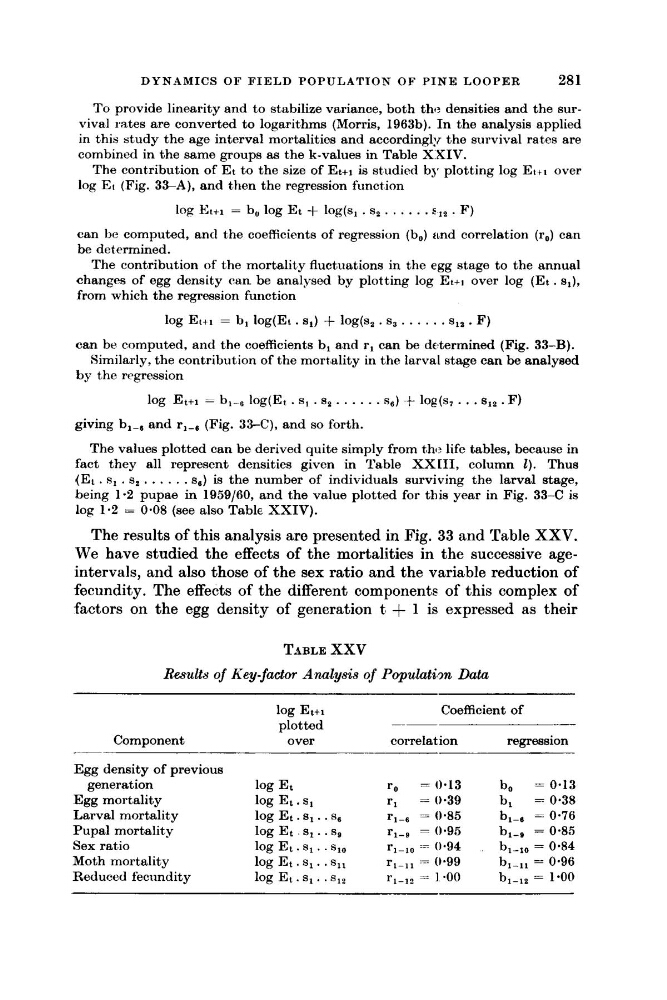
The results of this analysis are presented in Fig. 33 and Table XXV.
We have studied the effects of the mortalities in the successive ageintervals, and also those of the sex ratio and the variable reduction of
fecundity. The effects of the different components of this complex of
factors on the egg density of generation t + 1 is expressed as their
TABLE XXV
Results of Key-factor Analysis of Populatim Data
log Et+i
Coefficient of
plotted
-~
Component
over
correlation
regression
_--___
Egg density of previous
generation
log Et
ro
= 0.13
b,
= 0.13
Egg mortality
log Et . s1
r1 = 0.39
b,
= 0.38
Larval mortality
log Et . s1 . . s6
rl-@ = 0.85
bl-e = 0.76
Pupal mortality
log Et 9,. .sP
rl-o = 0.95
bl-9 = 0.85
Sex ratio
log Et . s1 . . sl0
rl-,,
0.94
b,-,, = 0.84
Moth mortality
log Et . S, . . sll
rl-,,
0.99
b,-,, = 0.96
Reduced fecundity
log EL. 5,. . s12
rl-,? = 1.00
b,-,, = 1.00
281
To provide linearity and to stabilize variance, both the densities and the survival rates are converted to logarithms (Morris, 1963b). In the analysis applied
in this study the age interval mortalities and accordingly the survival rates are
combined in the same groups as the k-values in Table XXIV.
The contribution of Et to the size of Et+l is studied bj' plotting log Ettl over
log Et (Fig. 33-A), and then the regression function
log Et+i = b, log Et + I o ~ ( s , . s2 . . . . . . ~ 1 2
. F)
can be computed, and the coefficients of regression (b,) m d correlation (r,) can
be determined.
The contribution of the mortality fluctuations in the egg stage to the annual
changes of egg density ran be analysed by plotting log Et+l over log (Et . s,),
from which the regression function
log Et+i = b, log(Et. 81) + log(s2. 6 3 . . . . . . 91,. F)
can be computed, and the coefficients b, and r1 can be determined (Fig. 33-B).
by the regression
Similarly, the contribution of the mortality in the larval stage can be analyeed
log Et+i = bl-6 log(Et . S, . S, . . . . . . s6) + 1 0 g ( ~ , . . . s,, . F)
giving b1-# and rl-& (Fig. 33-C), and so forth.
The values plotted can be derived quite simply from the life tables, because in
fact they all represent densities given in Table XXIII, column I ) . Thus
(Et . s1 . sz . . . . . . sa) is the number of individuals surviving the larval stage,
being 1-2 pupae in 1959/60, and the value plotted for this year in Fig. 33-C is
log 1.2 = 0.08 (see also Table XXIV).
The results of this analysis are presented in Fig. 33 and Table XXV.
We have studied the effects of the mortalities in the successive ageintervals, and also those of the sex ratio and the variable reduction of
fecundity. The effects of the different components of this complex of
factors on the egg density of generation t + 1 is expressed as their
TABLE XXV
Results of Key-factor Analysis of Populatim Data
log Et+i
Coefficient of
plotted
-~
Component
over
correlation
regression
_--___
Egg density of previous
generation
log Et
ro
= 0.13
b,
= 0.13
Egg mortality
log Et . s1
r1 = 0.39
b,
= 0.38
Larval mortality
log Et . s1 . . s6
rl-@ = 0.85
bl-e = 0.76
Pupal mortality
log Et 9,. .sP
rl-o = 0.95
bl-9 = 0.85
Sex ratio
log Et . s1 . . sl0
rl-,,
0.94
b,-,, = 0.84
Moth mortality
log Et . S, . . sll
rl-,,
0.99
b,-,, = 0.96
Reduced fecundity
log EL. 5,. . s12
rl-,? = 1.00
b,-,, = 1.00