

266
H. KLOMP
on p. 253 the means of fecundity represent the number of eggs deposited plus those few mature eggs present in the oviduct after death.
To gain an estimate of the number of eggs laid by females in the field
the mean number retained by the females under natural conditions
must be subtracted. This number averaged 3.8 for 85 females found dead
in the field at the end of the egg-laying period. Therefore, the fecundity
figures given in Table XXI are those gained in the cage experiments, of
which Fig. 14 gives two examples, but in all years decreased by 4 eggs.
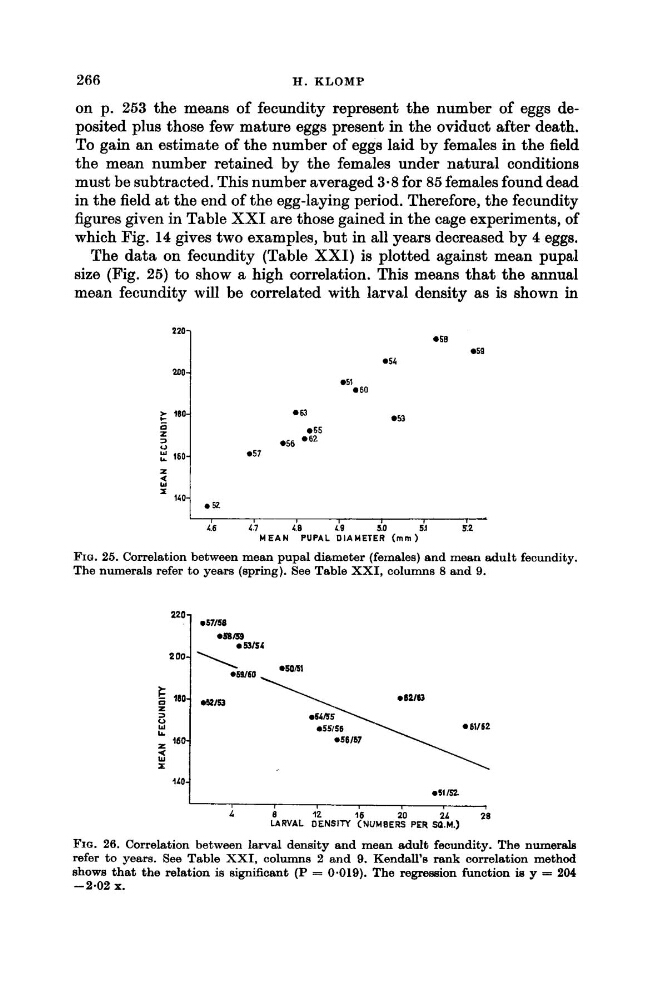
The data on fecundity (Table XXI) is plotted against mean pupal
size (Fig. 25) to show a high correlation. This means that the annual
mean fecundity will be correlated with larval density as is shown in
*I 200
051
0 60
050
059
054
I
053
180
063
0 5 5
056 06*
2 160
057
I
,
1.6
~ . 7
L B
L.D
5.0
SJ
5.2
M E A N PUPAL DIAMETER ( m m )
FIQ. 25. Correlation between mean pupal diameter (females) and mean adult fecundity.
The numerals refer to years (spring). See Table XXI, columns 8 and 9.
\
059160
z
3
0
w
L..
< w
I
061162
160058t67
" O i
a51t.52
I
7
L
8
12
16
20
2L
28
LARVAL DENSITY (NUMBERS PER sa.M.)
FIQ. 26. Correlation between larval density and mean adult fecundity. The numerals
refer to years. See Table XXI, columns 2 and 9. Kendall's rank correlation method
r h w s that the relation is sign5cant (P = 0.019). The regression function is y = 204
-2.02 x.
H. KLOMP
on p. 253 the means of fecundity represent the number of eggs deposited plus those few mature eggs present in the oviduct after death.
To gain an estimate of the number of eggs laid by females in the field
the mean number retained by the females under natural conditions
must be subtracted. This number averaged 3.8 for 85 females found dead
in the field at the end of the egg-laying period. Therefore, the fecundity
figures given in Table XXI are those gained in the cage experiments, of
which Fig. 14 gives two examples, but in all years decreased by 4 eggs.
The data on fecundity (Table XXI) is plotted against mean pupal
size (Fig. 25) to show a high correlation. This means that the annual
mean fecundity will be correlated with larval density as is shown in
*I 200
051
0 60
050
059
054
I
053
180
063
0 5 5
056 06*
2 160
057
I
,
1.6
~ . 7
L B
L.D
5.0
SJ
5.2
M E A N PUPAL DIAMETER ( m m )
FIQ. 25. Correlation between mean pupal diameter (females) and mean adult fecundity.
The numerals refer to years (spring). See Table XXI, columns 8 and 9.
\
059160
z
3
0
w
L..
< w
I
061162
160058t67
" O i
a51t.52
I
7
L
8
12
16
20
2L
28
LARVAL DENSITY (NUMBERS PER sa.M.)
FIQ. 26. Correlation between larval density and mean adult fecundity. The numerals
refer to years. See Table XXI, columns 2 and 9. Kendall's rank correlation method
r h w s that the relation is sign5cant (P = 0.019). The regression function is y = 204
-2.02 x.