

DYNAMICS OF FIELD POPULATION OF PINE LOOPER
216
1
a
Y
2 I 0
rh
rb
70
TRUNK CIRCUMFERENCE (em)
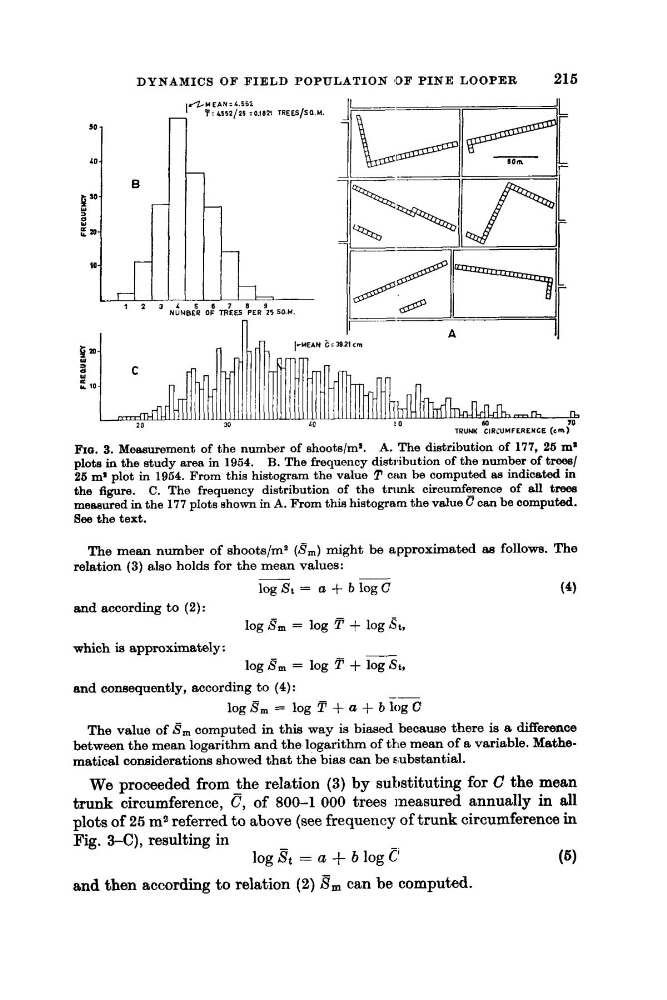
FIG. 3. Measurement of the number of shoots/m*. A. The distribution of 177, 26 ma
plots in the study area in 1954. B. The frequency distribution of the number of trees/
26 ma plot in 1964. From this histogram the value Ip crtn be computed as indicated in
the figure. C. The frequency distribution of the tnmk circumfe_rence of 811 tm
meesured in the 177 plots shown in A. From this histogram the value C can be computed.
See the text.
The mean number of shoots/ma (8,) might be approximated as follows. The
relation (3) also holds for the mean values:
-
__
log St = a + b log C
log 8, = log F + log St,
(4)
and according to (2) :
which is approximately:
-
and consequently, according to (4):
log 8, = log T + log St,
-log 8, = log ! i '
+ a + b log C
The value of 8, computed in this way is biased because there is a difference
between the mean logarithm and the logarithm of the mean of a variable. Mathematical considerations showed that the bias can be mbstantial.
We proceeded from the relation (3) by substituting for C the mean
trunk circumference, 8, of 800-1 000 trees measured annually in all
plots of 26 m2 referred to above (see frequency of trunk circumference in
Fig. a), resulting in
and then according t o relation (2) B, can be computed.
log Bt = a + b log C'
(5)
216
1
a
Y
2 I 0
rh
rb
70
TRUNK CIRCUMFERENCE (em)
FIG. 3. Measurement of the number of shoots/m*. A. The distribution of 177, 26 ma
plots in the study area in 1954. B. The frequency distribution of the number of trees/
26 ma plot in 1964. From this histogram the value Ip crtn be computed as indicated in
the figure. C. The frequency distribution of the tnmk circumfe_rence of 811 tm
meesured in the 177 plots shown in A. From this histogram the value C can be computed.
See the text.
The mean number of shoots/ma (8,) might be approximated as follows. The
relation (3) also holds for the mean values:
-
__
log St = a + b log C
log 8, = log F + log St,
(4)
and according to (2) :
which is approximately:
-
and consequently, according to (4):
log 8, = log T + log St,
-log 8, = log ! i '
+ a + b log C
The value of 8, computed in this way is biased because there is a difference
between the mean logarithm and the logarithm of the mean of a variable. Mathematical considerations showed that the bias can be mbstantial.
We proceeded from the relation (3) by substituting for C the mean
trunk circumference, 8, of 800-1 000 trees measured annually in all
plots of 26 m2 referred to above (see frequency of trunk circumference in
Fig. a), resulting in
and then according t o relation (2) B, can be computed.
log Bt = a + b log C'
(5)