

DYNAMICS O F FIELD POPULATION O F PINE LOOPER
213
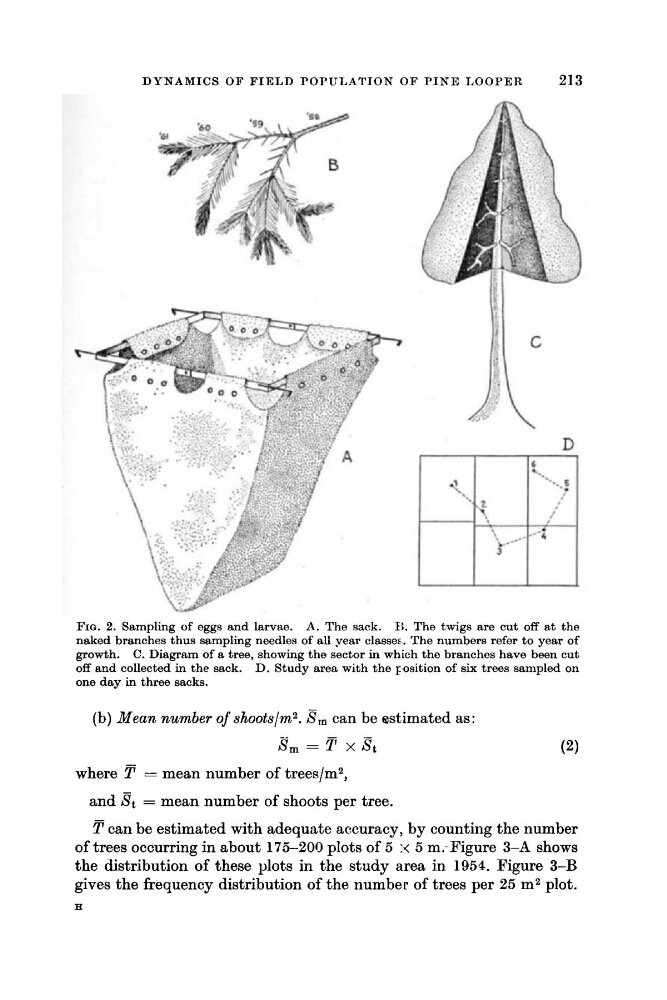
FIG. 2. Sampling of eggs and larvae.
I:. The twigs are cut off a t the
naked branches thus sampling needles of all year classes. The numbers refer to year of
growth. C. Diagram of a tree, showing the sector in which the branches have been cut
off and collected in the sack. D. Study area with the rosition of six trees sampled on
one day in three sacks.
A. The sack.
(b) Mean number of shoots/m2. sin can be estimated as:
s, = T x Bt
where
= mean number of trees/m2,
and & = mean number of shoots per tree.
can be estimated with adequate accuracy, by counting the number
of trees occurring in about 175-200 plots of 5 : < 5 m.-Figure 3-A shows
the distribution of these plots in the study area in 1954. Figure 3-B
gives the frequency distribution of the number of trees per 25 m2 plot.
H
213
FIG. 2. Sampling of eggs and larvae.
I:. The twigs are cut off a t the
naked branches thus sampling needles of all year classes. The numbers refer to year of
growth. C. Diagram of a tree, showing the sector in which the branches have been cut
off and collected in the sack. D. Study area with the rosition of six trees sampled on
one day in three sacks.
A. The sack.
(b) Mean number of shoots/m2. sin can be estimated as:
s, = T x Bt
where
= mean number of trees/m2,
and & = mean number of shoots per tree.
can be estimated with adequate accuracy, by counting the number
of trees occurring in about 175-200 plots of 5 : < 5 m.-Figure 3-A shows
the distribution of these plots in the study area in 1954. Figure 3-B
gives the frequency distribution of the number of trees per 25 m2 plot.
H