

34
M. E. SOLOMON
19.57
1925
1924
L
I
I
0
1 0
20
30
No. of 4Ih lorvoe and pupoe in soil, per armful of plant
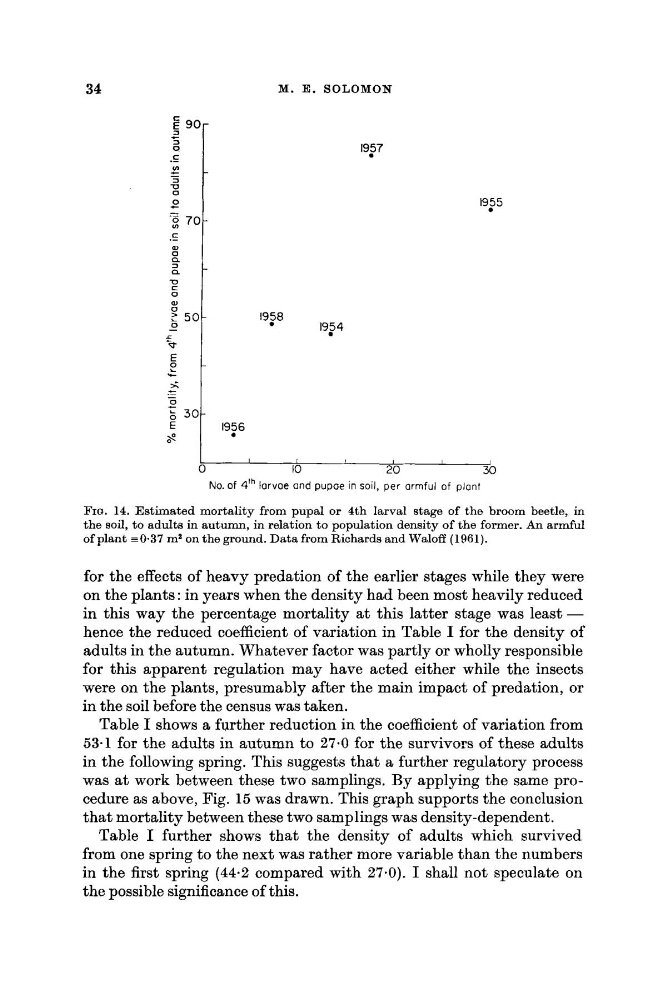
FIQ. 14. Estimated mortality from pupal or 4th larval stage of the broom beetle, in
the soil, to adults in autumn, in relation to population density of the former. An armful
of plant ~ 0 . 3 7
m2 on the ground. Data from Richards and Waloff (1961).
for the effects of heavy predation of the earlier stages while they were
on the plants : in years when the density had been most heavily reduced
in this way the percentage mortality a t this latter stage was least -
hence the reduced coefficient of variation in Table I for the density of
adults in the autumn. Whatever factor was partly or wholly responsible
for this apparent regulation may have acted either while the insects
were on the plants, presumably after the main impact of predation, or
in the soil before the census was taken.
Table I shows a further reduction in the coefficient of variation from
53-1 for the adults in autumn to 27-0 for the survivors of these adults
in the following spring. This suggests that a further regulatory process
was a t work between these two samplings. By applying the same procedure as above, Fig. 15 was drawn. This graph supports the conclusion
that mortality between these two samplings was density-dependent.
Table I further shows that the density of adults which survived
from one spring to the next was rather more variable than the numbers
in the first spring (44.2 compared with 27.0). I shall not speculate on
the possible significance of this.
M. E. SOLOMON
19.57
1925
1924
L
I
I
0
1 0
20
30
No. of 4Ih lorvoe and pupoe in soil, per armful of plant
FIQ. 14. Estimated mortality from pupal or 4th larval stage of the broom beetle, in
the soil, to adults in autumn, in relation to population density of the former. An armful
of plant ~ 0 . 3 7
m2 on the ground. Data from Richards and Waloff (1961).
for the effects of heavy predation of the earlier stages while they were
on the plants : in years when the density had been most heavily reduced
in this way the percentage mortality a t this latter stage was least -
hence the reduced coefficient of variation in Table I for the density of
adults in the autumn. Whatever factor was partly or wholly responsible
for this apparent regulation may have acted either while the insects
were on the plants, presumably after the main impact of predation, or
in the soil before the census was taken.
Table I shows a further reduction in the coefficient of variation from
53-1 for the adults in autumn to 27-0 for the survivors of these adults
in the following spring. This suggests that a further regulatory process
was a t work between these two samplings. By applying the same procedure as above, Fig. 15 was drawn. This graph supports the conclusion
that mortality between these two samplings was density-dependent.
Table I further shows that the density of adults which survived
from one spring to the next was rather more variable than the numbers
in the first spring (44.2 compared with 27.0). I shall not speculate on
the possible significance of this.