

32
M. E. SOLOMON
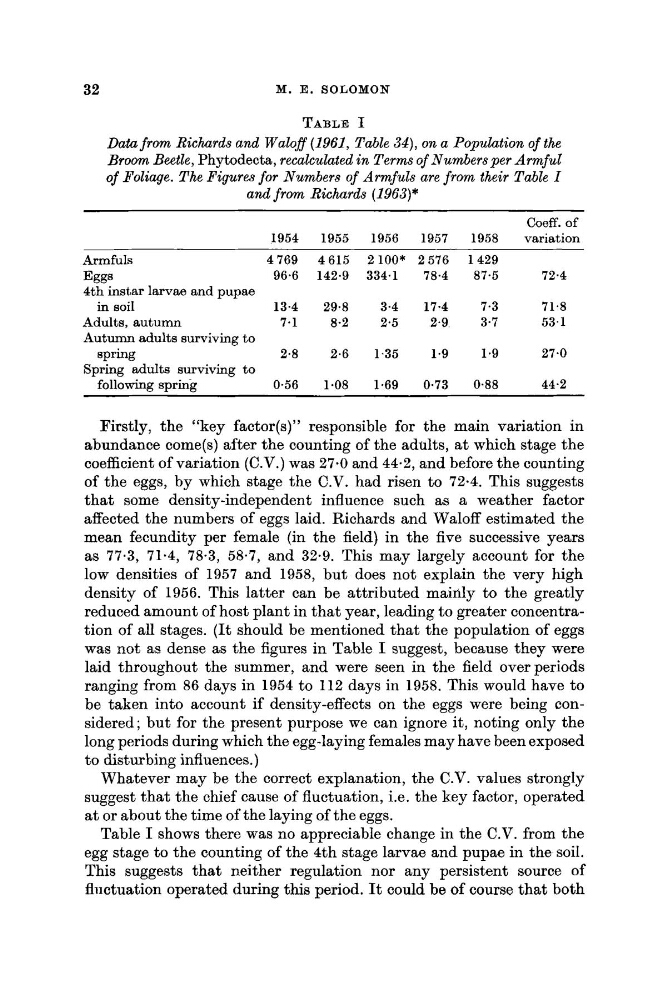
TABLE I
Data from Richards and Waloff (1961, Table 34), on a Population of the
Broom Beetle, Phytodecta, recalculated in Terms of Numbers per Armful
of B’oliage. The Figures for Numbers of Armfuls are from their Table I
and from Richards (1963)*
Coeff. of
1954
1955
1956
1957
1958
variation
Armfuls
4769 4615 2100* 2576 1429
4th instar larvae and pupae
in soil
13.4
29.8
3.4
17.4
7.3
71.8
Adults, autumn
7.1
8.2
2.5
2.9
3.7
53.1
Autumn adults surviving to
spring
2.8
2.6
1,35
1.9
1.9
27.0
Spring adults surviving to
Eggs
96.6 142.9 334.1
78.4
87.5
72.4
following spring
0.56
1.08
1.69
0.73
0.88
44.2
Firstly, the “key factor(s)” responsible for the main variation in
abundance comefs) after the counting of the adnlts, at which stage the
coefficient of variation (C.V.) was 27-0 and 44.2, and before the counting
of the eggs, by which stage the C.V. had risen to 72.4. This suggests
that some density-independent influence such as a weather factor
affected the numbers of eggs laid. Richards and Waloff estimated the
mean fecundity per female (in the field) in the five successive years
as 77.3, 71-4, 78.3, 58.7, and 32.9. This may largely account for the
low densities of 1957 and 1958, but does not explain the very high
density of 1956. This latter can be attributed mainly to the greatly
reduced amount of host plant in that year, leading to greater concentration of all stages. (It should be mentioned that the population of eggs
was not as dense as the figures in Table I suggest, because they were
laid throughout the summer, and were seen in the field overperiods
ranging from 86 days in 1954 to 112 days in 1958. This would have to
be taken into account if density-effects on the eggs were being considered; but for the present purpose we can ignore it, noting only the
long periods during which the egg-laying females may have been exposed
to disturbing influences.)
Whatever may be the correct explanation, the C.V. values strongly
suggest that the chief cause of fluctuation, i.e. the key factor, operated
at or about the time of the laying of the eggs.
Table I shows there was no appreciable change in the C.V. from the
egg stage to the counting of the 4th stage larvae and pupae in the soil.
This suggests that neither regulation nor any persistent source of
fliictuation operated during this period. It could be of course that both
M. E. SOLOMON
TABLE I
Data from Richards and Waloff (1961, Table 34), on a Population of the
Broom Beetle, Phytodecta, recalculated in Terms of Numbers per Armful
of B’oliage. The Figures for Numbers of Armfuls are from their Table I
and from Richards (1963)*
Coeff. of
1954
1955
1956
1957
1958
variation
Armfuls
4769 4615 2100* 2576 1429
4th instar larvae and pupae
in soil
13.4
29.8
3.4
17.4
7.3
71.8
Adults, autumn
7.1
8.2
2.5
2.9
3.7
53.1
Autumn adults surviving to
spring
2.8
2.6
1,35
1.9
1.9
27.0
Spring adults surviving to
Eggs
96.6 142.9 334.1
78.4
87.5
72.4
following spring
0.56
1.08
1.69
0.73
0.88
44.2
Firstly, the “key factor(s)” responsible for the main variation in
abundance comefs) after the counting of the adnlts, at which stage the
coefficient of variation (C.V.) was 27-0 and 44.2, and before the counting
of the eggs, by which stage the C.V. had risen to 72.4. This suggests
that some density-independent influence such as a weather factor
affected the numbers of eggs laid. Richards and Waloff estimated the
mean fecundity per female (in the field) in the five successive years
as 77.3, 71-4, 78.3, 58.7, and 32.9. This may largely account for the
low densities of 1957 and 1958, but does not explain the very high
density of 1956. This latter can be attributed mainly to the greatly
reduced amount of host plant in that year, leading to greater concentration of all stages. (It should be mentioned that the population of eggs
was not as dense as the figures in Table I suggest, because they were
laid throughout the summer, and were seen in the field overperiods
ranging from 86 days in 1954 to 112 days in 1958. This would have to
be taken into account if density-effects on the eggs were being considered; but for the present purpose we can ignore it, noting only the
long periods during which the egg-laying females may have been exposed
to disturbing influences.)
Whatever may be the correct explanation, the C.V. values strongly
suggest that the chief cause of fluctuation, i.e. the key factor, operated
at or about the time of the laying of the eggs.
Table I shows there was no appreciable change in the C.V. from the
egg stage to the counting of the 4th stage larvae and pupae in the soil.
This suggests that neither regulation nor any persistent source of
fliictuation operated during this period. It could be of course that both