

A N A L Y S I S O F P R O C E S S E S I N CONTROL O F I N S E C T S
29
0.1 r k~. -. / m-. -. -. ,
.-.-.-./.-.-.
-*
0 .o 1950
1955
1960
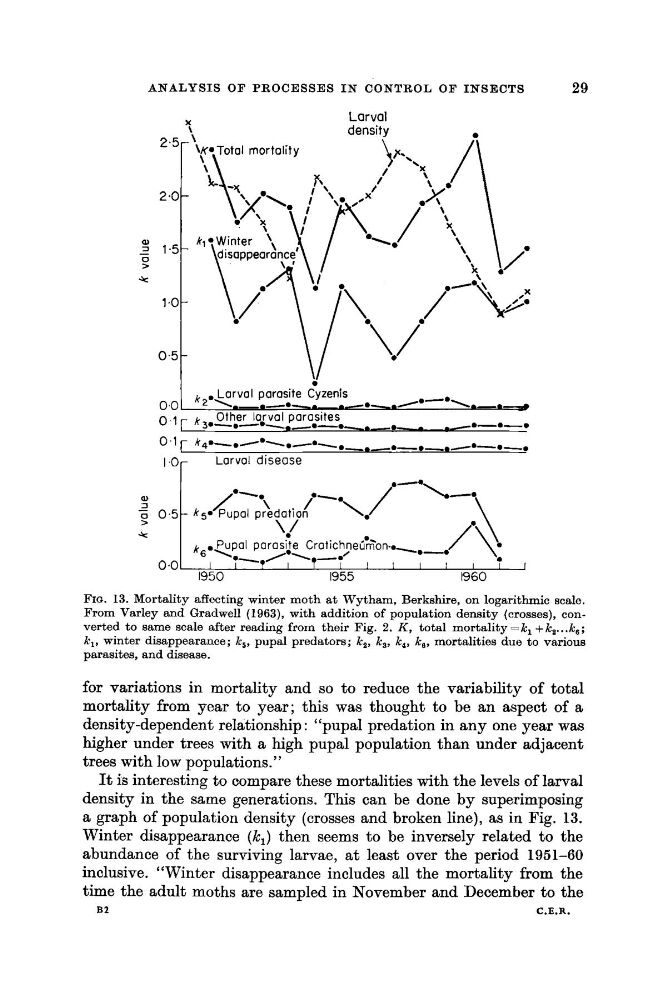
FIG. 13. Mortality affecting winter moth at Wytham, Berkshire, on logarithmic scale.
From Varley and Gradwell (1963), with addition of population density (crosses), converted to same scale after reading from their Fig. 2. K , total mortality=k, +k,...k,;
k,, winter disappearance; k,, pupal predators; k,, k,, k,, k,, mortalities due to various
parasites, and disease.
for variations in mortality and so to reduce the variability of total
mortality from year to year; this was thought to be an aspect of a
density-dependent relationship : “pupal predation in any one year was
higher under trees with a high pupal population than under adjacent
trees with low populations.”
It is interesting to compare these mortalities with the levels of larval
density in the same generations. This can be done by superimposing
a graph of population density (crosses and broken line), as in Fig. 13.
Winter disappearance (k,) then seems to be inversely related to the
abundance of the surviving larvae, at least over the period 1951-60
inclusive. “Winter disappearance includes all the mortality from the
time the adult moths are sampled in November and December to the
B2
C.E.R.
29
0.1 r k~. -. / m-. -. -. ,
.-.-.-./.-.-.
-*
0 .o 1950
1955
1960
FIG. 13. Mortality affecting winter moth at Wytham, Berkshire, on logarithmic scale.
From Varley and Gradwell (1963), with addition of population density (crosses), converted to same scale after reading from their Fig. 2. K , total mortality=k, +k,...k,;
k,, winter disappearance; k,, pupal predators; k,, k,, k,, k,, mortalities due to various
parasites, and disease.
for variations in mortality and so to reduce the variability of total
mortality from year to year; this was thought to be an aspect of a
density-dependent relationship : “pupal predation in any one year was
higher under trees with a high pupal population than under adjacent
trees with low populations.”
It is interesting to compare these mortalities with the levels of larval
density in the same generations. This can be done by superimposing
a graph of population density (crosses and broken line), as in Fig. 13.
Winter disappearance (k,) then seems to be inversely related to the
abundance of the surviving larvae, at least over the period 1951-60
inclusive. “Winter disappearance includes all the mortality from the
time the adult moths are sampled in November and December to the
B2
C.E.R.