

10. D N A A N D R N A S Y N T H E S I S
3 2 3
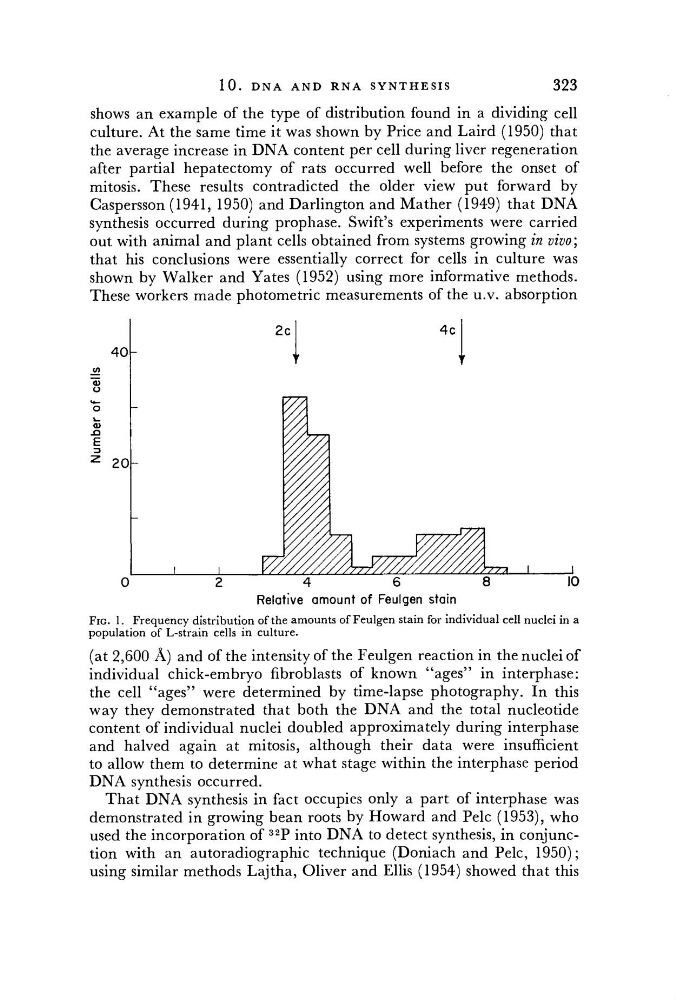
shows an example of the type of distribution found in a dividing cell
culture. At the same time it was shown by Price and Laird (1950) that
the average increase in D N A content per cell during liver regeneration
after partial hepatectomy of rats occurred well before the onset of
mitosis. These results contradicted the older view put forward by
Caspersson (1941, 1950) and Darlington and Mather (1949) that D N A
synthesis occurred during prophase. Swift's experiments were carried
out with animal and plant cells obtained from systems growing in vivo;
that his conclusions were essentially correct for cells in culture was
shown by Walker and Yates (1952) using more informative methods.
These workers made photometric measurements of the u.v. absorption
40h
0
2
4
6
Relative amount of Feulgen stain
FIG. 1. Frequency distribution ofthe amounts of Feulgen stain for individual cell nuclei in a
population of L-strain cells in culture.
(at 2,600 A) and ofthe intensity of the Feulgen reaction in the nuclei o f
individual chick-embryo fibroblasts of known "ages" in interphase:
the cell "ages" were determined by time-lapse photography. In this
way they demonstrated that both the D N A and the total nucleotide
content of individual nuclei doubled approximately during interphase
and halved again at mitosis, although their data were insufficient
to allow them to determine at what stage within the interphase period
DNA synthesis occurred.
That D N A synthesis in fact occupies only a part of interphase was
demonstrated in growing bean roots by Howard and Pelc (1953), who
used the incorporation of
3 2
P into D N A to detect synthesis, in conjunction with an autoradiographic technique (Doniach and Pelc, 1950);
using similar methods Lajtha, Oliver and Ellis (1954) showed that this
Number of cells
3 2 3
shows an example of the type of distribution found in a dividing cell
culture. At the same time it was shown by Price and Laird (1950) that
the average increase in D N A content per cell during liver regeneration
after partial hepatectomy of rats occurred well before the onset of
mitosis. These results contradicted the older view put forward by
Caspersson (1941, 1950) and Darlington and Mather (1949) that D N A
synthesis occurred during prophase. Swift's experiments were carried
out with animal and plant cells obtained from systems growing in vivo;
that his conclusions were essentially correct for cells in culture was
shown by Walker and Yates (1952) using more informative methods.
These workers made photometric measurements of the u.v. absorption
40h
0
2
4
6
Relative amount of Feulgen stain
FIG. 1. Frequency distribution ofthe amounts of Feulgen stain for individual cell nuclei in a
population of L-strain cells in culture.
(at 2,600 A) and ofthe intensity of the Feulgen reaction in the nuclei o f
individual chick-embryo fibroblasts of known "ages" in interphase:
the cell "ages" were determined by time-lapse photography. In this
way they demonstrated that both the D N A and the total nucleotide
content of individual nuclei doubled approximately during interphase
and halved again at mitosis, although their data were insufficient
to allow them to determine at what stage within the interphase period
DNA synthesis occurred.
That D N A synthesis in fact occupies only a part of interphase was
demonstrated in growing bean roots by Howard and Pelc (1953), who
used the incorporation of
3 2
P into D N A to detect synthesis, in conjunction with an autoradiographic technique (Doniach and Pelc, 1950);
using similar methods Lajtha, Oliver and Ellis (1954) showed that this
Number of cells