

242
J O H N
P A U L
fifjL mole A T P
required
Cell
Total amount
strain
Substance
fifig
/x/xmole Synthesis T u r n o v e r *
Totals
L5178
Lipid
_ _
(Mouse
Protein
80
0-7
2
0-2
ascites
Nucleic acid
30
0-1
0
0-14 (4)
l y m p h o m a )
Glycogen
—
—
—
—
(4)
2-0
0-34 (4-2)
2-34 (6-2)
Strain L
Lipid
82
1-3
- 2 - 7
_
(Mouse
Protein
364
3-2
9 6
1-5
fibroblast)
Nucleic acid
58
0-2
0
0-3 (19-2)
Glycogen
—
—
—
—
(19-2)
6-9
1-8 (20-7)
8-7
(27-6)
H e L a
Lipid
30
0-5
- 1
_
( H u m a n
Protein
700
6-0
18
3-5
carcinoma)
Nucleic acid
60
0-2
0
0-3 (36)
Glycogen
80
1-0
1-0
—
(36)
18
3-8 (39-5) 21-8
(57-5)
In all cases the figures are given for one cell. The calculations are based on the formation
of the substances listed from a medium containing a complete amino-acid mixture and an
excess of glucose. The average molecular weights of monomers and the number of molecules
of A T P required to synthesize and polymerize one monomeric unit were taken as follows
(ATP in parentheses). Lipid (as fatty acid), 60(—2); protein, 115(3); nucleic acids, 300(0);
glycogen, 162(2). In computing turnover values it is assumed that 3 A T P are required for
each peptide bond and 2 A T P for each nucleic acid phosphate diester linkage.
•Protein turnover is estimated at 1%/h. Nucleic acid turnover is estimated at 5%/h.
All figures in parentheses are calculated on the basis of the non-conservative "messenger
R N A " hypothesis which demands the polymerization of 3 nucleotides for each peptide
bond formed.
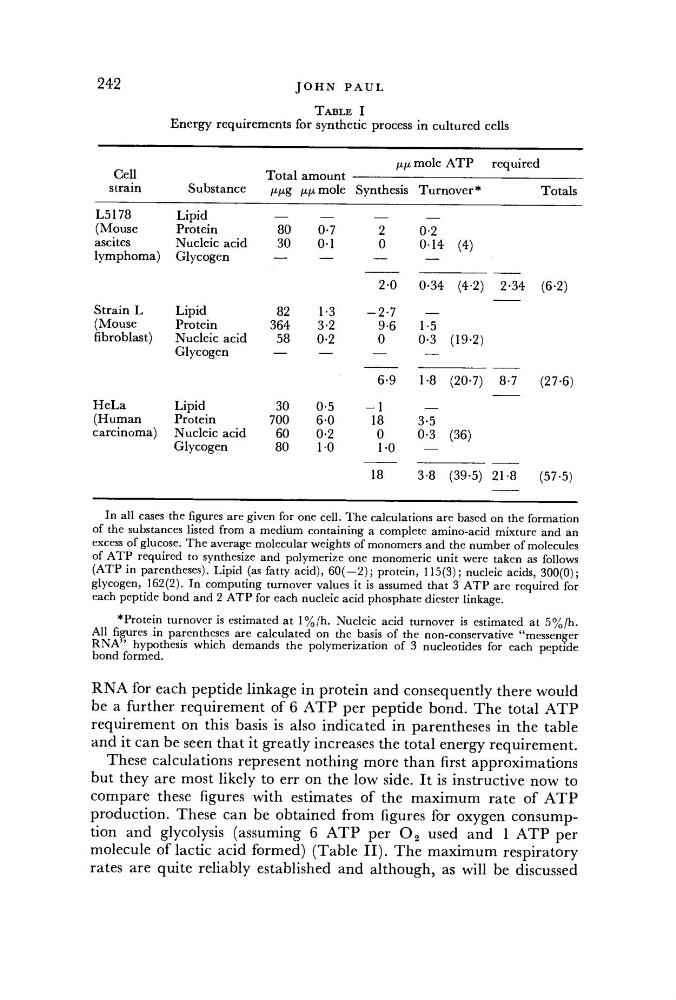
R N A for each peptide linkage in protein and consequently there would
be a further requirement of 6 A T P per peptide bond. The total A T P
requirement on this basis is also indicated in parentheses in the table
and it can be seen that it greatly increases the total energy requirement.
These calculations represent nothing more than first approximations
but they are most likely to err on the low side. It is instructive now to
compare these figures with estimates of the maximum rate of A T P
production. These can be obtained from figures for oxygen consumption and glycolysis (assuming 6 A T P per 0 2 used and 1 A T P per
molecule of lactic acid formed) (Table II). The maximum respiratory
rates are quite reliably established and although, as will be discussed
T A B L E I
Energy requirements for synthetic process in cultured cells
J O H N
P A U L
fifjL mole A T P
required
Cell
Total amount
strain
Substance
fifig
/x/xmole Synthesis T u r n o v e r *
Totals
L5178
Lipid
_ _
(Mouse
Protein
80
0-7
2
0-2
ascites
Nucleic acid
30
0-1
0
0-14 (4)
l y m p h o m a )
Glycogen
—
—
—
—
(4)
2-0
0-34 (4-2)
2-34 (6-2)
Strain L
Lipid
82
1-3
- 2 - 7
_
(Mouse
Protein
364
3-2
9 6
1-5
fibroblast)
Nucleic acid
58
0-2
0
0-3 (19-2)
Glycogen
—
—
—
—
(19-2)
6-9
1-8 (20-7)
8-7
(27-6)
H e L a
Lipid
30
0-5
- 1
_
( H u m a n
Protein
700
6-0
18
3-5
carcinoma)
Nucleic acid
60
0-2
0
0-3 (36)
Glycogen
80
1-0
1-0
—
(36)
18
3-8 (39-5) 21-8
(57-5)
In all cases the figures are given for one cell. The calculations are based on the formation
of the substances listed from a medium containing a complete amino-acid mixture and an
excess of glucose. The average molecular weights of monomers and the number of molecules
of A T P required to synthesize and polymerize one monomeric unit were taken as follows
(ATP in parentheses). Lipid (as fatty acid), 60(—2); protein, 115(3); nucleic acids, 300(0);
glycogen, 162(2). In computing turnover values it is assumed that 3 A T P are required for
each peptide bond and 2 A T P for each nucleic acid phosphate diester linkage.
•Protein turnover is estimated at 1%/h. Nucleic acid turnover is estimated at 5%/h.
All figures in parentheses are calculated on the basis of the non-conservative "messenger
R N A " hypothesis which demands the polymerization of 3 nucleotides for each peptide
bond formed.
R N A for each peptide linkage in protein and consequently there would
be a further requirement of 6 A T P per peptide bond. The total A T P
requirement on this basis is also indicated in parentheses in the table
and it can be seen that it greatly increases the total energy requirement.
These calculations represent nothing more than first approximations
but they are most likely to err on the low side. It is instructive now to
compare these figures with estimates of the maximum rate of A T P
production. These can be obtained from figures for oxygen consumption and glycolysis (assuming 6 A T P per 0 2 used and 1 A T P per
molecule of lactic acid formed) (Table II). The maximum respiratory
rates are quite reliably established and although, as will be discussed
T A B L E I
Energy requirements for synthetic process in cultured cells