

136
5. Sensitivity
of Planning Decisions in River Basin
Management
of the matrix signifies that output I is affected by input k. No entry signifies
no relationship between I and k. For example, consider the dependent
variables that determine the year of construction of each dam, \ Jt . Note
that
"V
[Mi
is a vector that shows the year in which project j is constructed and the
pattern of investment involved, e.g., the vector
λ 3 = [0,1,1,1,0,0,..·,07
signifies that project 3 was built in year 2 and the financing of the project
was spread over 3 years. The sensitivity coefficients show how λ/varies with
perturbations in the inputs.
5.4. Example of a Sensitivity Analysis of the MD River
Basin Model
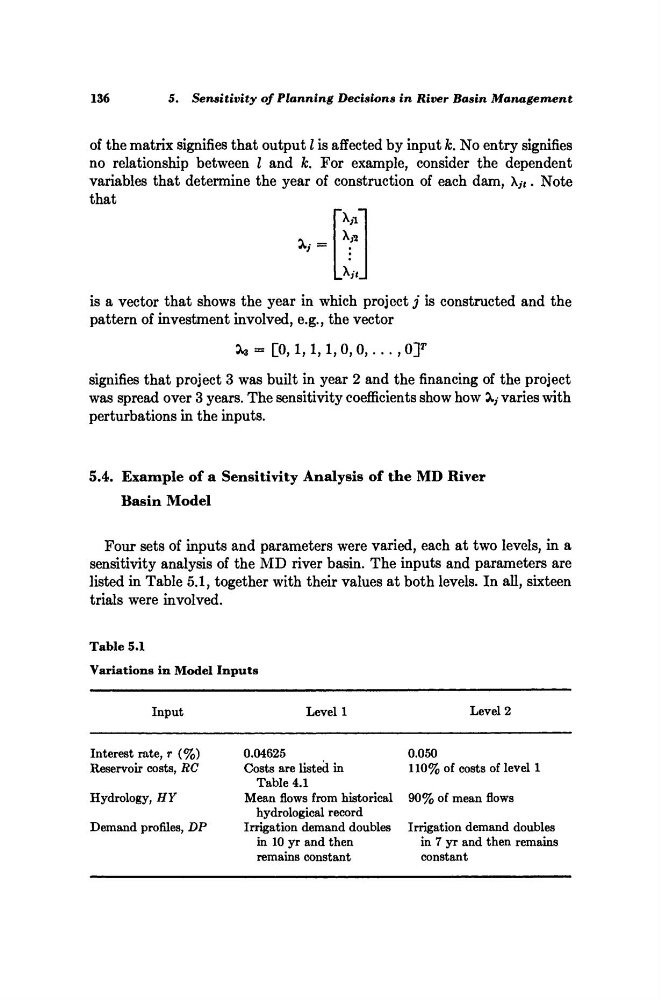
Four sets of inputs and parameters were varied, each at two levels, in a
sensitivity analysis of the MD river basin. The inputs and parameters are
listed in Table 5.1, together with their values at both levels. In all, sixteen
trials were involved.
Table 5.1
Variations in Model Inputs
Input
Level 1
Level 2
Interest rate, r (%)
Reservoir costs, RC
Hydrology, HY
Demand profiles, DP
0.04625
Costs are listed in
Table 4.1
Mean flows from historical
hydrological record
Irrigation demand doubles
in 10 yr and then
remains constant
0.050
110% of costs of level 1
90% of mean flows
Irrigation demand doubles
in 7 yr and then remains
constant
5. Sensitivity
of Planning Decisions in River Basin
Management
of the matrix signifies that output I is affected by input k. No entry signifies
no relationship between I and k. For example, consider the dependent
variables that determine the year of construction of each dam, \ Jt . Note
that
"V
[Mi
is a vector that shows the year in which project j is constructed and the
pattern of investment involved, e.g., the vector
λ 3 = [0,1,1,1,0,0,..·,07
signifies that project 3 was built in year 2 and the financing of the project
was spread over 3 years. The sensitivity coefficients show how λ/varies with
perturbations in the inputs.
5.4. Example of a Sensitivity Analysis of the MD River
Basin Model
Four sets of inputs and parameters were varied, each at two levels, in a
sensitivity analysis of the MD river basin. The inputs and parameters are
listed in Table 5.1, together with their values at both levels. In all, sixteen
trials were involved.
Table 5.1
Variations in Model Inputs
Input
Level 1
Level 2
Interest rate, r (%)
Reservoir costs, RC
Hydrology, HY
Demand profiles, DP
0.04625
Costs are listed in
Table 4.1
Mean flows from historical
hydrological record
Irrigation demand doubles
in 10 yr and then
remains constant
0.050
110% of costs of level 1
90% of mean flows
Irrigation demand doubles
in 7 yr and then remains
constant