

184
5.
SECTIONING
edge, but when sectioning is going poorly it may be desirable to do this
without delay.
5.24. Estimation of Section Thickness
In the early days of ultrathin sectioning for electron microscopy it was
a time-consuming process, taxing one's patience, to scan screen after screen
with the electron microscope before finding sections thin enough to be
useful. Our efficiency was vastly increased when it was realized that interference colors could be used in estimating section thickness, and so one
could have the foreknowledge that suitably thin sections were being cut
and mounted. This discovery was first formalized by Porter and Blum
(1953).
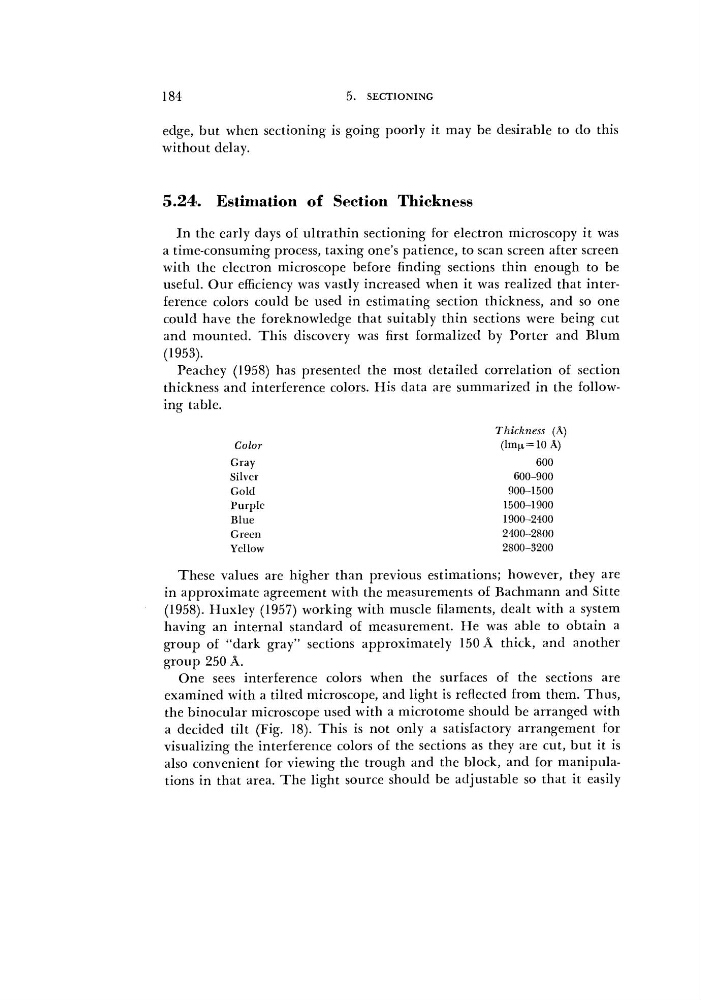
Peachey (1958) has presented the most detailed correlation of section
thickness and interference colors. His data are summarized in the following table.
Thickness
(A)
Color
(lm|Li=10A)
Gray
600
Silver
600-900
Gold
900-1500
Purple
1500-1900
Blue
1900-2400
Green
2400-2800
Yellow
2800-3200
These values are higher than previous estimations; however, they are
in approximate agreement with the measurements of Bachmann and Sitte
(1958). Huxley (1957) working with muscle filaments, dealt with a system
having an internal standard of measurement. He was able to obtain a
group of "dark gray" sections approximately 150 A thick, and another
group 250 A.
One sees interference colors when the surfaces of the sections are
examined with a tilted microscope, and light is reflected from them. Thus,
the binocular microscope used with a microtome should be arranged with
a decided tilt (Fig. 18). This is not only a satisfactory arrangement for
visualizing the interference colors of the sections as they are cut, but it is
also convenient for viewing the trough and the block, and for manipulations in that area. The light source should be adjustable so that it easily
5.
SECTIONING
edge, but when sectioning is going poorly it may be desirable to do this
without delay.
5.24. Estimation of Section Thickness
In the early days of ultrathin sectioning for electron microscopy it was
a time-consuming process, taxing one's patience, to scan screen after screen
with the electron microscope before finding sections thin enough to be
useful. Our efficiency was vastly increased when it was realized that interference colors could be used in estimating section thickness, and so one
could have the foreknowledge that suitably thin sections were being cut
and mounted. This discovery was first formalized by Porter and Blum
(1953).
Peachey (1958) has presented the most detailed correlation of section
thickness and interference colors. His data are summarized in the following table.
Thickness
(A)
Color
(lm|Li=10A)
Gray
600
Silver
600-900
Gold
900-1500
Purple
1500-1900
Blue
1900-2400
Green
2400-2800
Yellow
2800-3200
These values are higher than previous estimations; however, they are
in approximate agreement with the measurements of Bachmann and Sitte
(1958). Huxley (1957) working with muscle filaments, dealt with a system
having an internal standard of measurement. He was able to obtain a
group of "dark gray" sections approximately 150 A thick, and another
group 250 A.
One sees interference colors when the surfaces of the sections are
examined with a tilted microscope, and light is reflected from them. Thus,
the binocular microscope used with a microtome should be arranged with
a decided tilt (Fig. 18). This is not only a satisfactory arrangement for
visualizing the interference colors of the sections as they are cut, but it is
also convenient for viewing the trough and the block, and for manipulations in that area. The light source should be adjustable so that it easily