

64
WALLACE H. FULLER
Phosphorus of desert soils in Arizona are primarily calcium phosphates
which have a low degree of availability to plants (Fuller and McGeorge,
1950a). However compared with the predominantly aluminum and ferric
phosphates in acid soils of humid regions, they are somewhat more available to plants. Desert soils contain an adequate supply of native phosphorus to produce crops for many centuries under present cropping
systems, yet some soils show crop-yield response to phosphate fertilizer
applications. Native vegetation under normal rainfall conditions, however,
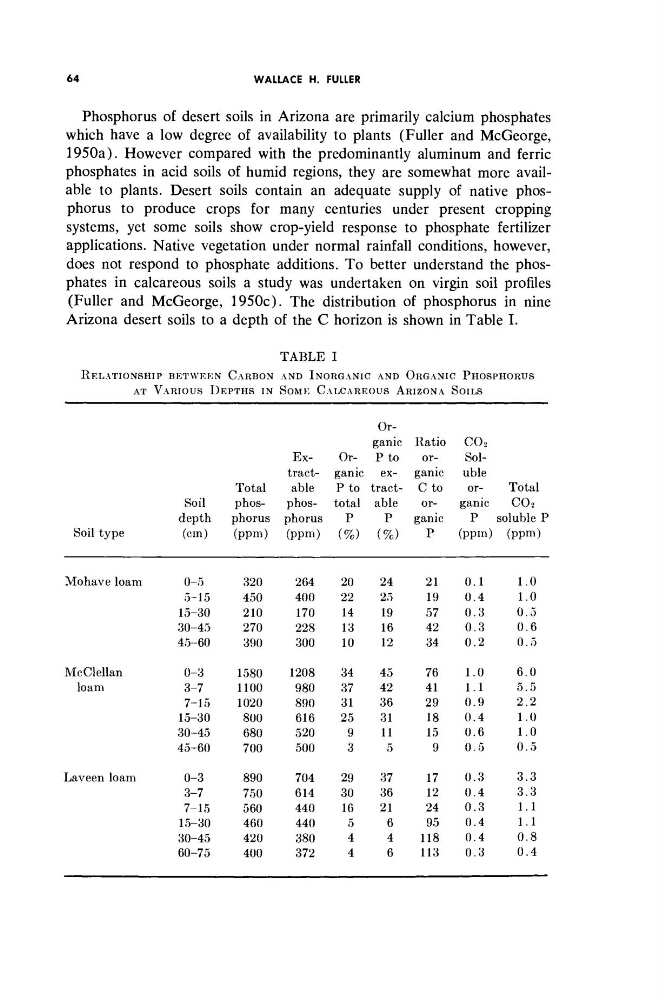
does not respond to phosphate additions. To better understand the phosphates in calcareous soils a study was undertaken on virgin soil profiles
(Fuller and McGeorge, 1950c). The distribution of phosphorus in nine
Arizona desert soils to a depth of the C horizon is shown in Table I.
TABLE I
RELATIONSHIP BETWEEN CARBON AND INORGANIC AND ORGANIC PHOSPHORUS
AT VARIOUS D E P T H S IN SOME CALCAREOUS ARIZONA SOILS
Soil type
Mohave loam
McClellan
loam
Laveen loam
Soil
depth
(cm)
0-5
5-15
15-30
30-45
45-60
0-3
3-7
7-15
15-30
30-45
45-60
0-3
3-7
7-15
15-30
30-45
60-75
Total
phosphorus
(ppm)
320
450
210
270
390
1580
1100
1020
800
680
700
890
750
560
460
420
400
tractable
phosphorus
(ppm)
264
400
170
228
300
1208
980
890
616
520
500
704
614
440
440
380
372
Organic
P to
total
P
(%)
20
22
14
13
10
34
37
31
25
9
3
29
30
16
5
4
4
Organic
P to
tractable
P
(%)
24
25
19
16
12
45
42
36
31
11
5
37
36
21
6
4
6
Ratio
organic
C to
organic
P
21
19
57
42
34
76
41
29
18
15
9
17
12
24
95
118
113
C 0 2
Soluble
organic
P
(ppm)
0.1
0.4
0.3
0.3
0.2
1.0
1.1
0.9
0.4
0.6
0.5
0.3
0.4
0 . 3
0.4
0.4
0.3
Total
C 0 2
soluble P
(ppm)
1.0
1.0
0.5
0.6
0.5
6.0
5.5
2.2
1.0
1.0
0.5
3.3
3.3
1.1
1.1
0.8
0.4
WALLACE H. FULLER
Phosphorus of desert soils in Arizona are primarily calcium phosphates
which have a low degree of availability to plants (Fuller and McGeorge,
1950a). However compared with the predominantly aluminum and ferric
phosphates in acid soils of humid regions, they are somewhat more available to plants. Desert soils contain an adequate supply of native phosphorus to produce crops for many centuries under present cropping
systems, yet some soils show crop-yield response to phosphate fertilizer
applications. Native vegetation under normal rainfall conditions, however,
does not respond to phosphate additions. To better understand the phosphates in calcareous soils a study was undertaken on virgin soil profiles
(Fuller and McGeorge, 1950c). The distribution of phosphorus in nine
Arizona desert soils to a depth of the C horizon is shown in Table I.
TABLE I
RELATIONSHIP BETWEEN CARBON AND INORGANIC AND ORGANIC PHOSPHORUS
AT VARIOUS D E P T H S IN SOME CALCAREOUS ARIZONA SOILS
Soil type
Mohave loam
McClellan
loam
Laveen loam
Soil
depth
(cm)
0-5
5-15
15-30
30-45
45-60
0-3
3-7
7-15
15-30
30-45
45-60
0-3
3-7
7-15
15-30
30-45
60-75
Total
phosphorus
(ppm)
320
450
210
270
390
1580
1100
1020
800
680
700
890
750
560
460
420
400
tractable
phosphorus
(ppm)
264
400
170
228
300
1208
980
890
616
520
500
704
614
440
440
380
372
Organic
P to
total
P
(%)
20
22
14
13
10
34
37
31
25
9
3
29
30
16
5
4
4
Organic
P to
tractable
P
(%)
24
25
19
16
12
45
42
36
31
11
5
37
36
21
6
4
6
Ratio
organic
C to
organic
P
21
19
57
42
34
76
41
29
18
15
9
17
12
24
95
118
113
C 0 2
Soluble
organic
P
(ppm)
0.1
0.4
0.3
0.3
0.2
1.0
1.1
0.9
0.4
0.6
0.5
0.3
0.4
0 . 3
0.4
0.4
0.3
Total
C 0 2
soluble P
(ppm)
1.0
1.0
0.5
0.6
0.5
6.0
5.5
2.2
1.0
1.0
0.5
3.3
3.3
1.1
1.1
0.8
0.4