

230
H. WALTER AND E. STADELMANN
SA
4H
57
ΓΓ 55
Ί
49
(ID
__J
5 8
Ί
ι
_J
5 1012
(I)
"I
(VI)
ίΓ
1
53
LJL_J
1 6
(VHIb)
(X)
1 5 9
5 10
X_J
1 5 8
(III)
L__I_L_J
1 5
(IV)
(V)
13
5 9 (Villa)
(VII)
lrLJjix
(IX)l
I
xJ
1
6
(XI)
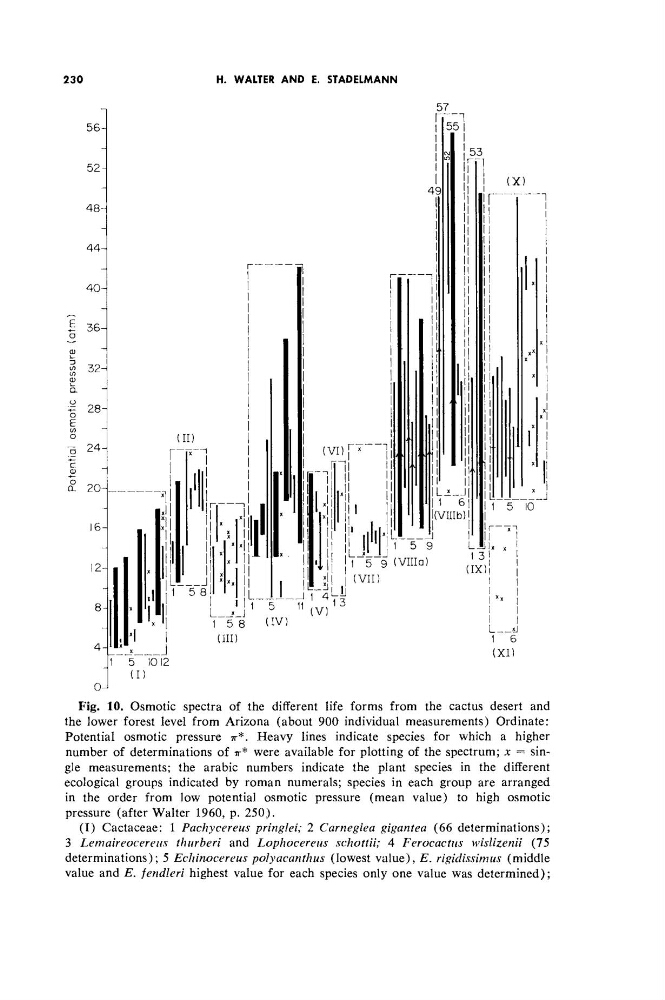
Fig. 10. Osmotic spectra of the different life forms from the cactus desert and
the lower forest level from Arizona (about 900 individual measurements) Ordinate:
Potential osmotic pressure ττ*. Heavy lines indicate species for which a higher
number of determinations of π* were available for plotting of the spectrum; x = single measurements; the arabic numbers indicate the plant species in the different
ecological groups indicated by roman numerals; species in each group are arranged
in the order from low potential osmotic pressure (mean value) to high osmotic
pressure (after Walter 1960, p. 250).
(I) Cactaceae: 1 Pachycereus pringlei; 2 Carnegiea gigantea (66 determinations);
3 Lemaireocereus
thurberi and Lophocereus schottii; 4 Ferocactus wislizenii (75
determinations); 5 Echinocereus polyacanthus (lowest value), E. rigidissimus (middle
value and E. fendleri highest value for each species only one value was determined);
H. WALTER AND E. STADELMANN
SA
4H
57
ΓΓ 55
Ί
49
(ID
__J
5 8
Ί
ι
_J
5 1012
(I)
"I
(VI)
ίΓ
1
53
LJL_J
1 6
(VHIb)
(X)
1 5 9
5 10
X_J
1 5 8
(III)
L__I_L_J
1 5
(IV)
(V)
13
5 9 (Villa)
(VII)
lrLJjix
(IX)l
I
xJ
1
6
(XI)
Fig. 10. Osmotic spectra of the different life forms from the cactus desert and
the lower forest level from Arizona (about 900 individual measurements) Ordinate:
Potential osmotic pressure ττ*. Heavy lines indicate species for which a higher
number of determinations of π* were available for plotting of the spectrum; x = single measurements; the arabic numbers indicate the plant species in the different
ecological groups indicated by roman numerals; species in each group are arranged
in the order from low potential osmotic pressure (mean value) to high osmotic
pressure (after Walter 1960, p. 250).
(I) Cactaceae: 1 Pachycereus pringlei; 2 Carnegiea gigantea (66 determinations);
3 Lemaireocereus
thurberi and Lophocereus schottii; 4 Ferocactus wislizenii (75
determinations); 5 Echinocereus polyacanthus (lowest value), E. rigidissimus (middle
value and E. fendleri highest value for each species only one value was determined);