

STEADY-STATE STABLE IU)t'NDARY LAYER
81
shoot nnrrnalized by I/* incream with stability although the change is
hardly significant if seen as a percentage of u,/u, or c j u , . The stress profiles
(Figs. R and 9) are similar to those for the neutral Ekman layer except for the
increase in their curvature with increasing stability.
The most significant effect of stability brought out by the calculated velocity and stress profiles is the change in the boundary layer height, whichever
way one defines it. In Fig. 10 we have represented the dimensionless heights
<, and &.. where after the first cross-over and overshoot ii = u, and 6 = us,
respectively. The latter is about 25 % greater than the former. The level i,,
where uh;' = 0 after the first zero cross-over and change in sign falls in
between <, , and i,,. It corresponds to a minimum in the ii profile. The height
corresponding to the maximum of i profile is also sometimes used as a
measure of the boundary layer height (Clarke, 1970). This, however, is only
about half of t,, and, since there is still considerable amount of the lateral
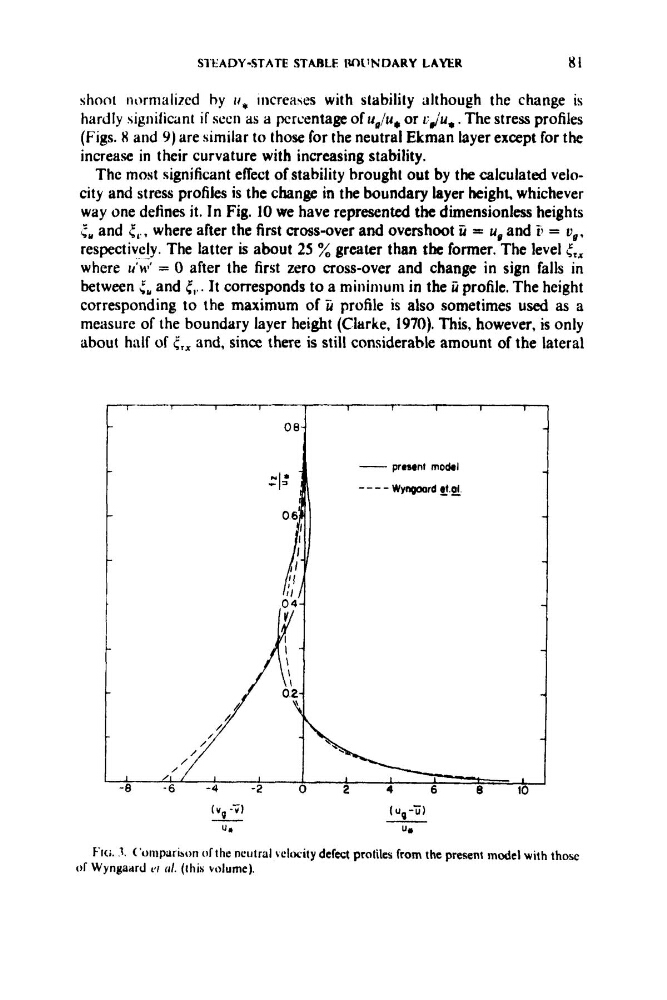
FICL 3. ('oinparisoii ofthe neutral wlcxity defect protiks from the present model with those
of Wyngarrd I,/ crl. (tliih volume).
81
shoot nnrrnalized by I/* incream with stability although the change is
hardly significant if seen as a percentage of u,/u, or c j u , . The stress profiles
(Figs. R and 9) are similar to those for the neutral Ekman layer except for the
increase in their curvature with increasing stability.
The most significant effect of stability brought out by the calculated velocity and stress profiles is the change in the boundary layer height, whichever
way one defines it. In Fig. 10 we have represented the dimensionless heights
<, and &.. where after the first cross-over and overshoot ii = u, and 6 = us,
respectively. The latter is about 25 % greater than the former. The level i,,
where uh;' = 0 after the first zero cross-over and change in sign falls in
between <, , and i,,. It corresponds to a minimum in the ii profile. The height
corresponding to the maximum of i profile is also sometimes used as a
measure of the boundary layer height (Clarke, 1970). This, however, is only
about half of t,, and, since there is still considerable amount of the lateral
FICL 3. ('oinparisoii ofthe neutral wlcxity defect protiks from the present model with those
of Wyngarrd I,/ crl. (tliih volume).