

STRUCTURE OF DENSITY INTERFACES
c
E
-
I
a '
a .
4 -
a
a
a
a
a .
..a
0
@
a
a *
a
a*
a .
a
a
m a a 0 8
a
3@ a
a 4
@.a
ma
# . L a
a.
a
a
a
4
a
a
a
a .
aa
11
1
1
1
I
I
I
I
I
1
I
0
'
2
4
6
8
10
12
14
16
18
20
22
437
i
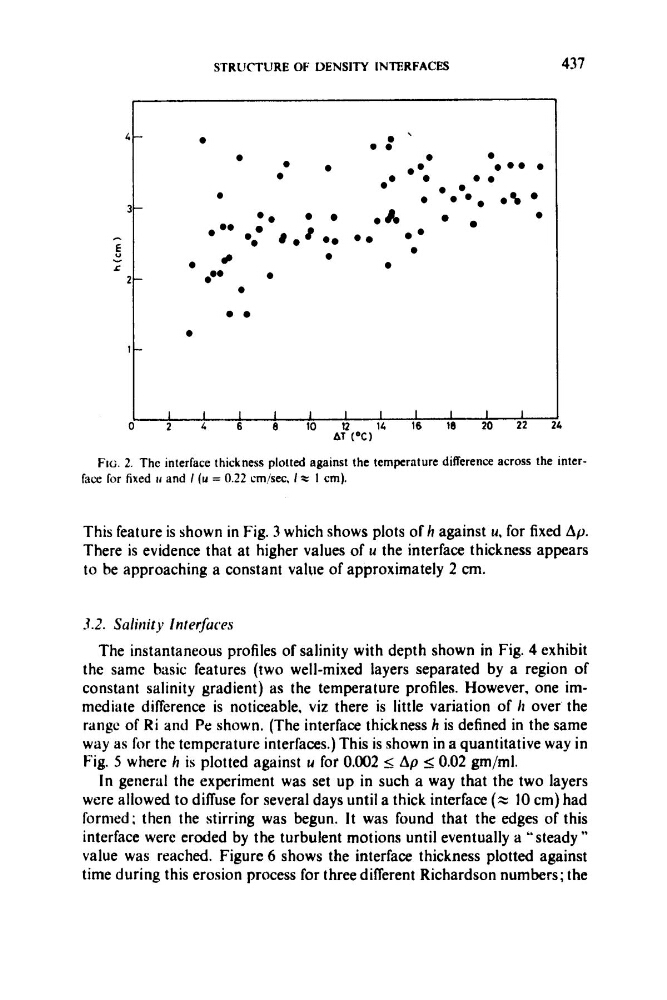
FIG. 2. The interface thickness plotted against the temperature difference across the interface for fixed I I and / (u = 0.22 crnisec. I t 1 crn).
This feature is shown in Fig. 3 which shows plots of h against u, for fixed Ap.
There is evidence that at higher values of u the interface thickness appears
to be approaching a constant valpe of approximately 2 cm.
3.2. Saliriitj? InlerJucas
The instantaneous profiles of salinity with depth shown in Fig. 4 exhibit
the same basic features (two well-mixed layers separated by a region of
constant salinity gradient) as the temperature profiles. However, one immediate difference is noticeable, viz there is little variation of It over the
r a n g of Ri and Pe shown. (The interface thickness h is defined in the same
way as for the temperature interfaces.) This is shown in a quantitative way in
Fig. 5 where h is plotted against u for 0.002 5 Ap 5 0.02 gm/ml.
In general the experiment was set up in such a way that the two layers
were allowed to diffuse for several days until a thick interface (z 10 cm) had
formed; then the stirring was begun. It was found that the edges of this
interface were eroded by the turbulent motions until eventually a "steady "
value was reached. Figure 6 shows the interface thickness plotted against
time during this erosion process for three different Richardson numbers; the
c
E
-
I
a '
a .
4 -
a
a
a
a
a .
..a
0
@
a
a *
a
a*
a .
a
a
m a a 0 8
a
3@ a
a 4
@.a
ma
# . L a
a.
a
a
a
4
a
a
a
a .
aa
11
1
1
1
I
I
I
I
I
1
I
0
'
2
4
6
8
10
12
14
16
18
20
22
437
i
FIG. 2. The interface thickness plotted against the temperature difference across the interface for fixed I I and / (u = 0.22 crnisec. I t 1 crn).
This feature is shown in Fig. 3 which shows plots of h against u, for fixed Ap.
There is evidence that at higher values of u the interface thickness appears
to be approaching a constant valpe of approximately 2 cm.
3.2. Saliriitj? InlerJucas
The instantaneous profiles of salinity with depth shown in Fig. 4 exhibit
the same basic features (two well-mixed layers separated by a region of
constant salinity gradient) as the temperature profiles. However, one immediate difference is noticeable, viz there is little variation of It over the
r a n g of Ri and Pe shown. (The interface thickness h is defined in the same
way as for the temperature interfaces.) This is shown in a quantitative way in
Fig. 5 where h is plotted against u for 0.002 5 Ap 5 0.02 gm/ml.
In general the experiment was set up in such a way that the two layers
were allowed to diffuse for several days until a thick interface (z 10 cm) had
formed; then the stirring was begun. It was found that the edges of this
interface were eroded by the turbulent motions until eventually a "steady "
value was reached. Figure 6 shows the interface thickness plotted against
time during this erosion process for three different Richardson numbers; the