

4'3
0.5
0.4
(F
0
0
N *
0 . 3
E
- ..
-
C
- 2 0.2
c
0. I
0
.a
PERIOD (minuter)
30
3
0.3
.03
I
1
I
1
( 7 )
RURAL
N. I0
L A G RANGIAN
EULERIAN
1
I
I
I
.OOl
.01
0. 1
FREQUENCY (cycler roc-I)
D
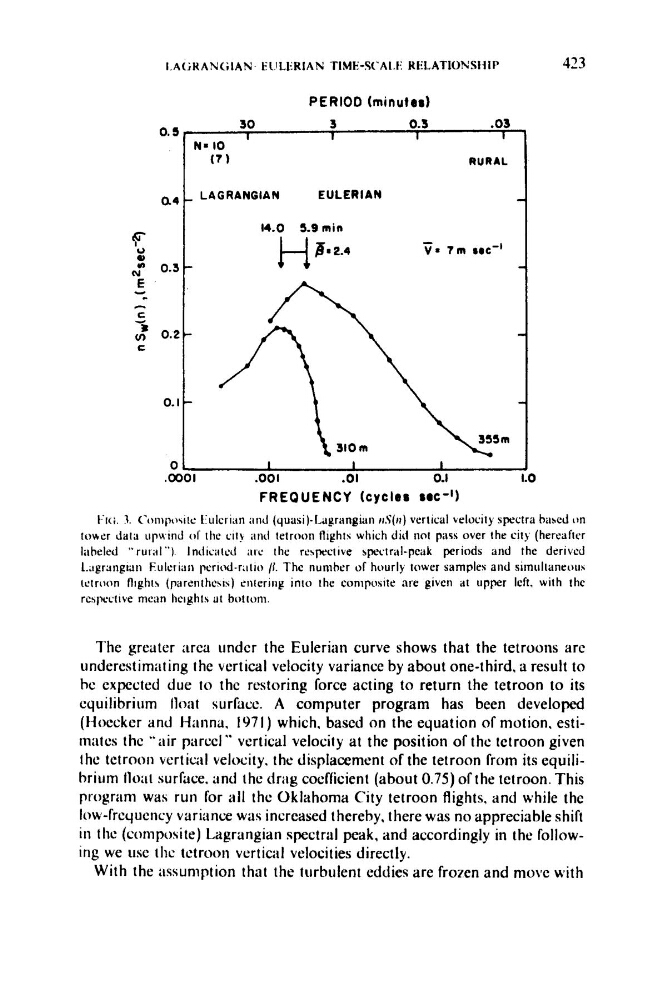
t i c ; . 3. C.oniixwte Hulcriiin :ind (quasi)-I,aerangi;ui rrS(n) vertical velocity spectra h a d o n
t o w r data tipwind of the city nnd tetroon flights which did not pars over the city (hereafter
hbeled "rulal"). Indicated ;iIc thc rrspective spectral-peak periods iind the derivrd
L.;igrltnpiltn Fulrriiiii periidmlio /I. The nuniher of hourly tower samples and simul~anetrus
trtrtmn flights (parenthesis) enteriiig into the coniposlte are given at upper left. with the
rtsiwctive mean heights ilt bottom.
The greater area ilndcr the Eulerian curve shows that the tetroons are
underostimating the vertical velocity variance by about one-third, a result to
hc expected due to the restoring force acting to return the tetroon to its
cquilibrium h a t surface. A computer program has been developed
(Hoccker and Hi1nna. I97 I ) which, based on the equation of mot ion. estitniites the "air parccl" vertical velocity at the position of the tetroon given
the tetroon vcrticiil velocity, the displacement of the tetroon from its equilibrium Iloitt surface. and the drag cocfficienl (about 0.75) ofthr tetroon. This
program was run for all the Oklahoma City tetroon flights, and while the
low-frequency variance was increased thereby. there was no appreciable shift
in tho (composite) Lagrangian spectral peak, and accordingly in the following we use the tctroon vertical velocities directly.
With the assumption that the turbulent eddies are frozen and move with
0.5
0.4
(F
0
0
N *
0 . 3
E
- ..
-
C
- 2 0.2
c
0. I
0
.a
PERIOD (minuter)
30
3
0.3
.03
I
1
I
1
( 7 )
RURAL
N. I0
L A G RANGIAN
EULERIAN
1
I
I
I
.OOl
.01
0. 1
FREQUENCY (cycler roc-I)
D
t i c ; . 3. C.oniixwte Hulcriiin :ind (quasi)-I,aerangi;ui rrS(n) vertical velocity spectra h a d o n
t o w r data tipwind of the city nnd tetroon flights which did not pars over the city (hereafter
hbeled "rulal"). Indicated ;iIc thc rrspective spectral-peak periods iind the derivrd
L.;igrltnpiltn Fulrriiiii periidmlio /I. The nuniher of hourly tower samples and simul~anetrus
trtrtmn flights (parenthesis) enteriiig into the coniposlte are given at upper left. with the
rtsiwctive mean heights ilt bottom.
The greater area ilndcr the Eulerian curve shows that the tetroons are
underostimating the vertical velocity variance by about one-third, a result to
hc expected due to the restoring force acting to return the tetroon to its
cquilibrium h a t surface. A computer program has been developed
(Hoccker and Hi1nna. I97 I ) which, based on the equation of mot ion. estitniites the "air parccl" vertical velocity at the position of the tetroon given
the tetroon vcrticiil velocity, the displacement of the tetroon from its equilibrium Iloitt surface. and the drag cocfficienl (about 0.75) ofthr tetroon. This
program was run for all the Oklahoma City tetroon flights, and while the
low-frequency variance was increased thereby. there was no appreciable shift
in tho (composite) Lagrangian spectral peak, and accordingly in the following we use the tctroon vertical velocities directly.
With the assumption that the turbulent eddies are frozen and move with