

I.A(iRAN<;IAN EI1I.ERIAN TIME-S('A1.E RELATIONSHIP
42 1
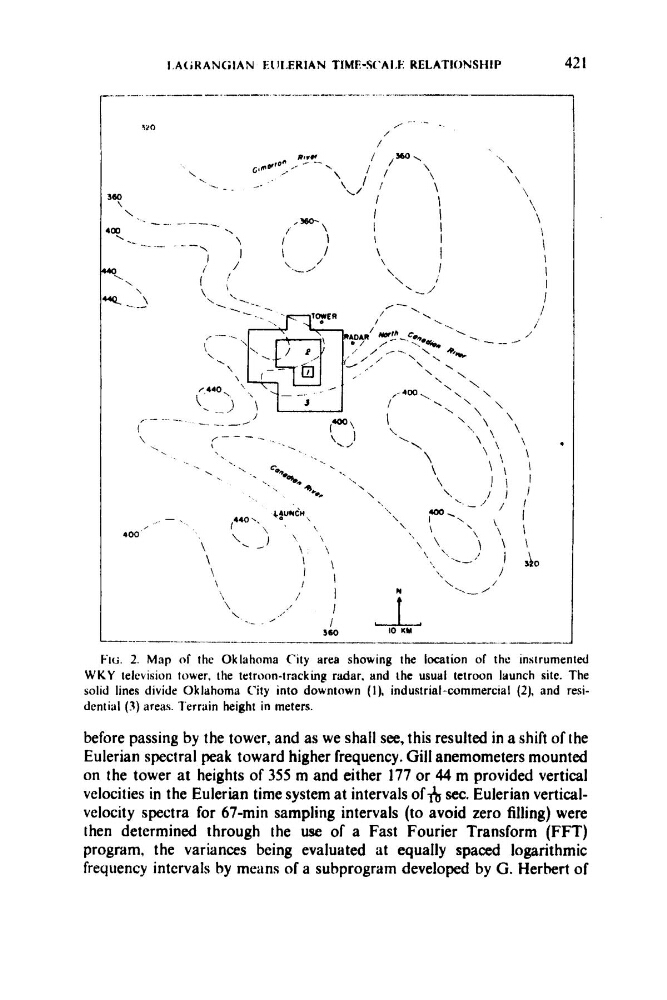
FIG 2. Map of the Oklahoma City area showing the location or the instrumented
WKY television tower, the tetroon-tracking radar. and the usual tetroon launch site. The
solid lines divide Oklahoma City into downtown (I), industrial-commercial (2), and residential (3) areas. Terrain height in meters.
before passing by the tower, and as we shall see, this resulted in a shift of the
Eulerian spectral peak toward higher frequency. Gill anemometers mounted
on the tower at heights of 355 m and either 177 or 44 m provided vertical
velocities in the Eulerian time system at intervals of& sec. Eulerian verticalvelocity spectra for 67-min sampling intervals (to avoid zero filling) were
then determined through the use of a Fast Fourier Transform (FFT)
program, the variances being evaluated at equally spaced logarithmic
frequency intcrvals by means of a subprogram developed by G. Herbert of
42 1
FIG 2. Map of the Oklahoma City area showing the location or the instrumented
WKY television tower, the tetroon-tracking radar. and the usual tetroon launch site. The
solid lines divide Oklahoma City into downtown (I), industrial-commercial (2), and residential (3) areas. Terrain height in meters.
before passing by the tower, and as we shall see, this resulted in a shift of the
Eulerian spectral peak toward higher frequency. Gill anemometers mounted
on the tower at heights of 355 m and either 177 or 44 m provided vertical
velocities in the Eulerian time system at intervals of& sec. Eulerian verticalvelocity spectra for 67-min sampling intervals (to avoid zero filling) were
then determined through the use of a Fast Fourier Transform (FFT)
program, the variances being evaluated at equally spaced logarithmic
frequency intcrvals by means of a subprogram developed by G. Herbert of