

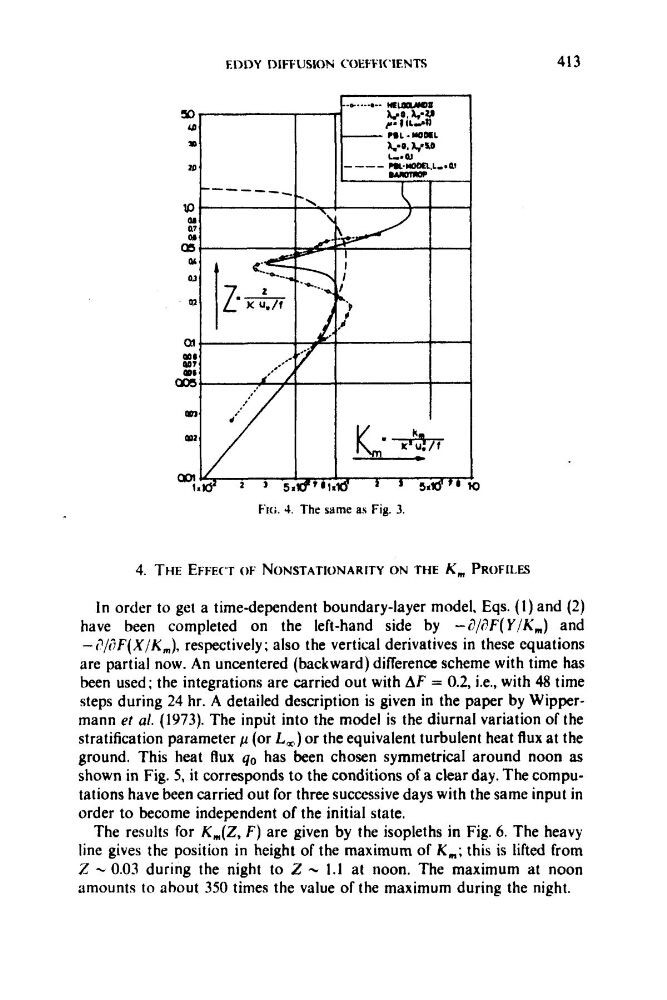
E D D Y I>IFFUSION COEFFI<'IENTS
413
0
4. THE E w w r OF NONSTATIONARITY ON THE K, PROFILES
In order to get a timedependent boundary-layer model, Eqs. (1) and (2)
have been completed on the left-hand side by -d/c!F(Y/K,) and
- ?/dF(X/K,), respectively; also the vertical derivatives in these equations
are partial now. An uncentered (backward) difference scheme with time has
been used; the integrations are carried out with AF = 0.2, i.e., with 48 time
steps during 24 hr. A detailed description is given in the paper by Wippermann er a/. (1973). The inpu't into the model is the diurnal variation of the
stratification parameter p (or L,) or the equivalent turbulent heat flux at the
ground. This heat flux yo has been chosen symmetrical around noon as
shown in Fig. 5, it corresponds to the conditions of a clear day. The computations have been carried out for three successive days with the same input in
order to become independent of the initial state.
The results for K,(Z, F) are given by the isopleths in Fig. 6. The heavy
line gives the position in height of the maximum of K,; this is lifted from
Z - 0.03 during the night to 2 - 1.1 at noon. The maximum at noon
amounts to about 350 times the value of the maximum during the night.
413
0
4. THE E w w r OF NONSTATIONARITY ON THE K, PROFILES
In order to get a timedependent boundary-layer model, Eqs. (1) and (2)
have been completed on the left-hand side by -d/c!F(Y/K,) and
- ?/dF(X/K,), respectively; also the vertical derivatives in these equations
are partial now. An uncentered (backward) difference scheme with time has
been used; the integrations are carried out with AF = 0.2, i.e., with 48 time
steps during 24 hr. A detailed description is given in the paper by Wippermann er a/. (1973). The inpu't into the model is the diurnal variation of the
stratification parameter p (or L,) or the equivalent turbulent heat flux at the
ground. This heat flux yo has been chosen symmetrical around noon as
shown in Fig. 5, it corresponds to the conditions of a clear day. The computations have been carried out for three successive days with the same input in
order to become independent of the initial state.
The results for K,(Z, F) are given by the isopleths in Fig. 6. The heavy
line gives the position in height of the maximum of K,; this is lifted from
Z - 0.03 during the night to 2 - 1.1 at noon. The maximum at noon
amounts to about 350 times the value of the maximum during the night.