

I>IFFlJSION 0 1 7 OCXANN’ 1iI:AT A N D MOMEN’TUM
36 I
FREQUENCY IHcl
It
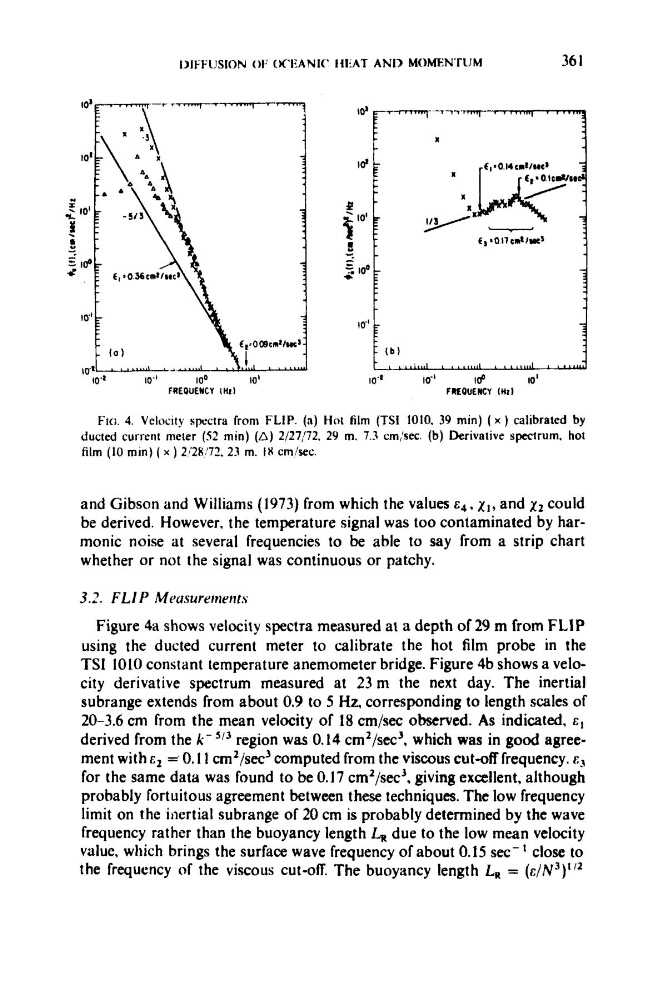
F i a 4. Velocity spectra from FLIP. (a) Hot lilm (TSI 1010. 39 min) ( x ) calibrated by
ducted current meter (52 min) (A) 2/27/72. 2Y m. 7.3 cm,‘sec. (b) Derivative spectrum. hot
film (10 min) ( x ) 2/28/72. 23 m. I8 cmisec.
and Gibson and Williams (1973) from which the values c4, xI, and x2 could
be derived. However, the temperature signal was too contaminated by harmonic noise at several frequencies to be able to say from a strip chart
whether or not the signal was continuous or patchy.
3.2. FLIP Mmwreirieiit.\
Figure 4a shows velocity spectra measured at a depth of 29 m from FLIP
using the ducted current meter to calibrate the hot film probe in the
TSI I010 constant temperature anemometer bridge. Figure 4b shows a velocity derivative spectrum measured at 23 m the next day. The inertial
subrange extends from about 0.9 to 5 Hz, corresponding to length scales of
20-3.6 cm from the mean velocity of 18 cm/sec observed. As indicated, cl
derived from the k - 513 region was 0.14 cm2/sec’, which was in good agreement with c2 = 0.1 1 cm2/sec3 computed from the viscous c u t 4 frequency. E~
for the same data was found to be 0.17 cm2/secJ, giving excellent, although
probably fortuitous agreement between these techniques. The low frequency
limit on the inertial subrange of 20 cm is probably determined by the wave
frequency rather than the buoyancy length due to the low mean velocity
value, which brings the surface wave frequency of about 0.15 see-’ close to
the frequency of the viscous cut-off. The buoyancy length LR = ( c / N ~ ) ’ / ~
36 I
FREQUENCY IHcl
It
F i a 4. Velocity spectra from FLIP. (a) Hot lilm (TSI 1010. 39 min) ( x ) calibrated by
ducted current meter (52 min) (A) 2/27/72. 2Y m. 7.3 cm,‘sec. (b) Derivative spectrum. hot
film (10 min) ( x ) 2/28/72. 23 m. I8 cmisec.
and Gibson and Williams (1973) from which the values c4, xI, and x2 could
be derived. However, the temperature signal was too contaminated by harmonic noise at several frequencies to be able to say from a strip chart
whether or not the signal was continuous or patchy.
3.2. FLIP Mmwreirieiit.\
Figure 4a shows velocity spectra measured at a depth of 29 m from FLIP
using the ducted current meter to calibrate the hot film probe in the
TSI I010 constant temperature anemometer bridge. Figure 4b shows a velocity derivative spectrum measured at 23 m the next day. The inertial
subrange extends from about 0.9 to 5 Hz, corresponding to length scales of
20-3.6 cm from the mean velocity of 18 cm/sec observed. As indicated, cl
derived from the k - 513 region was 0.14 cm2/sec’, which was in good agreement with c2 = 0.1 1 cm2/sec3 computed from the viscous c u t 4 frequency. E~
for the same data was found to be 0.17 cm2/secJ, giving excellent, although
probably fortuitous agreement between these techniques. The low frequency
limit on the inertial subrange of 20 cm is probably determined by the wave
frequency rather than the buoyancy length due to the low mean velocity
value, which brings the surface wave frequency of about 0.15 see-’ close to
the frequency of the viscous cut-off. The buoyancy length LR = ( c / N ~ ) ’ / ~