

TURBULENCE IN AN INTERNAL BOUNDARY LAYER
279
.
& e
0 0
Icr4 1
(0-2
to-'
to0
a'
ma
&*
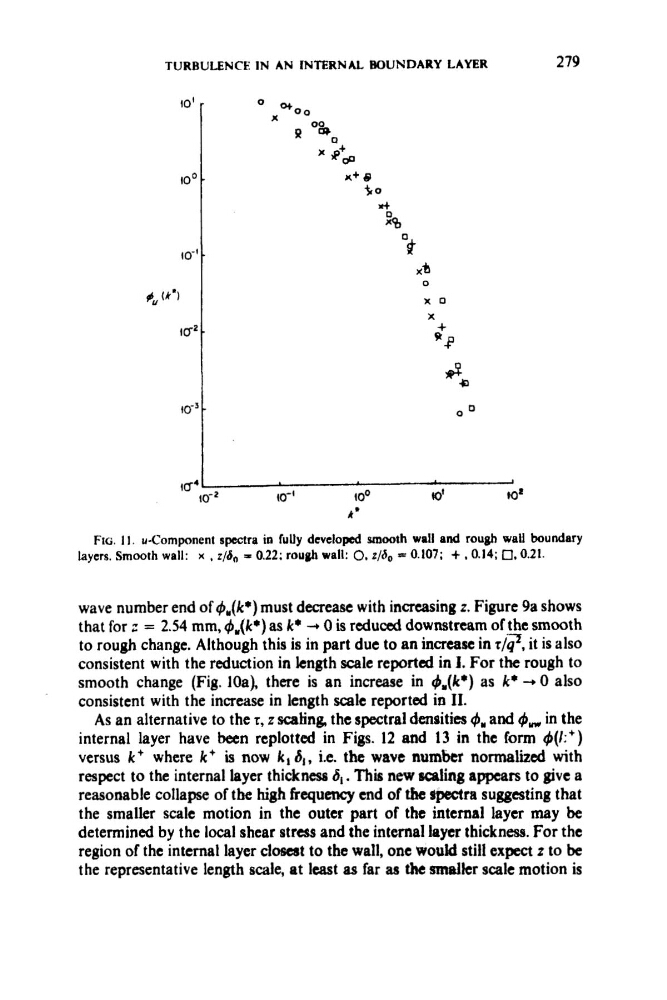
Fro. 11. u-Component spectra in fuUy developed .smooth wall and rough wall boundary
layers. Smooth wall: x , z/S, = 0.22; rougb wall: 0. z/a, = 0.107; + , 0.14; 0.0.21.
wave number end of #,(k*) must decrease with increasing z. Figure 9a shows
that for r" = 2.54 mm, t$,(k*) as k+ -+ 0 is reduced downstream of the smooth
to rough change. Although this is in part due to an increase in 7@, it is also
consistent with the reduction in length scale reported in I. For the rough to
smooth change (Fig. lOa), there is an increase in 4,(k*) as k* -+ 0 also
consistent with the increase in length scale reported in 11.
As an alternative to the 5, z scaling, the spectral densities 9, and C
p
, in the
internal layer have betn replotted in Figs. 12 and 13 in the form 4(r:+)
versus k+ where k+ is now klS1, i.e. the wave number normalized with
respect to the internal layer thickness J1. This new scaling appears to give a
reasonable collapse of the high frequency end of the spectra suggesting that
the smaller scale motion in the outer part of the internal layer may be
determined by the local shear stress and the internal layer thickness. For the
region of the internal layer clostst to the wall, one would still expect z to be
the representative length scale, at least as far as the smalkr scale motion is
279
.
& e
0 0
Icr4 1
(0-2
to-'
to0
a'
ma
&*
Fro. 11. u-Component spectra in fuUy developed .smooth wall and rough wall boundary
layers. Smooth wall: x , z/S, = 0.22; rougb wall: 0. z/a, = 0.107; + , 0.14; 0.0.21.
wave number end of #,(k*) must decrease with increasing z. Figure 9a shows
that for r" = 2.54 mm, t$,(k*) as k+ -+ 0 is reduced downstream of the smooth
to rough change. Although this is in part due to an increase in 7@, it is also
consistent with the reduction in length scale reported in I. For the rough to
smooth change (Fig. lOa), there is an increase in 4,(k*) as k* -+ 0 also
consistent with the increase in length scale reported in 11.
As an alternative to the 5, z scaling, the spectral densities 9, and C
p
, in the
internal layer have betn replotted in Figs. 12 and 13 in the form 4(r:+)
versus k+ where k+ is now klS1, i.e. the wave number normalized with
respect to the internal layer thickness J1. This new scaling appears to give a
reasonable collapse of the high frequency end of the spectra suggesting that
the smaller scale motion in the outer part of the internal layer may be
determined by the local shear stress and the internal layer thickness. For the
region of the internal layer clostst to the wall, one would still expect z to be
the representative length scale, at least as far as the smalkr scale motion is