

TURBULENCE IN AN INTERNAL BOUNDARY LAYER
265
replaced by 1.22-m smooth surface. The free steam velocity used for all the
measurements discussed here was approximately 5.58 m/s and the pressure
gradient was set to zero. This gave a boundary layer thickness So at the
beginning of the rough surface of approximately 48 mm and a momentum
thickness Reynolds number i$ of about 3OOO. At the end of the first 1.22 m
of roughness the boundary layer was found to be nearly self-preserving with
the 99.5 % thickness3 equal to about 71 mm and a corrtsponding 1% of 430.
Thameasurements of u, w, and uw were made with an X-wire operated by
nonlinearized constant temperature anemometers. Tke anemometer outputs
were amplified, filtered by sharp cut-off low pass filters set at I kHz and
digitized at a sampling rate of 3 kHz on the digital data acquisition facility
mentioned in I. Final processing of the data was done on the English Electric
KDF9 computer in the Basser Computing Laboratory at the University of
Sydney. All digital records were analyzed for a duration of approximately
10 s. This was adequate to yield a standard deviation of about 10 % for the
third and fourth moments presented in Section 3, and also for most of the
spectral estimates (obtained via the FFT technique) of Section 5.
3. SKEWNESS AND FLATNESS FACTORS OF U, W AND UW
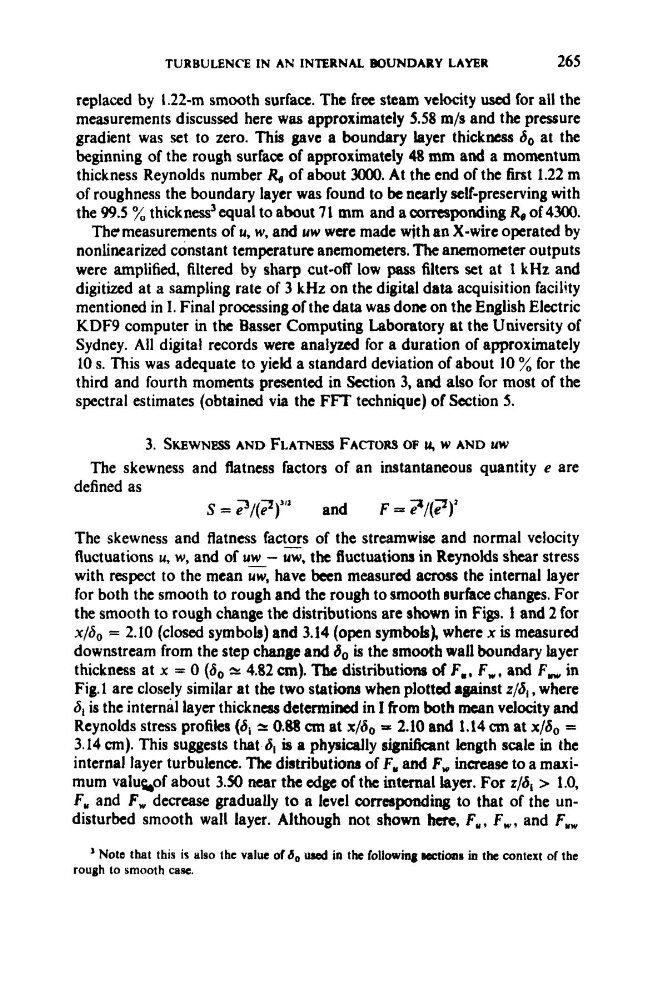
The skewness and flatness factors of an instantaneous quantity e are
S = 7/(2ria and F = e /(e )
The skewness and flatness factors of the streamwise and normal velocity
fluctuations u, w, and of uw - z, the fluctuations in Reynolds shear stress
with respect to the mean %, have been measured across the internal layer
for both the smooth to rough and the rough to smooth surface changes. For
the smooth to rough change the distributions are shown in Figs. 1 and 2 for
x/S, = 2.10 (closed symbols) and 3.14 (open symbol), where x is measured
downstream from the step change and 6,, is the smooth wall boundary layer
thickness at x = 0 (6, C= 4.82 cm). The distributions of F,, F,, and F, in
Fig. 1 are closely similar at the two stationa when plotted a m s t z/6,, where
6, is the internil layer thickness determined in I from both mean velocity and
Reynolds stress profiles (6, c* 0.88 cm at x/ii0 = 2.10 and 1.14 an at x/6, =
3.14 cm). This suggests that 6, is a physically significant h g t h scale in the
internal layer turbulence. The distributions of F, and F, increase to a maximum valuftof about 3.50 near the edge of the internal layer. For z/S, > 1.0,
F, and F, decrease gradually to a level corraponding to that of the undisturbed smooth wall layer. Although not shown here, F,, F,, and F,,
defined as
7 7 2
’ Note that this is also the valw of 8, used in the following wtima in the context of the
rough to smooth case.
265
replaced by 1.22-m smooth surface. The free steam velocity used for all the
measurements discussed here was approximately 5.58 m/s and the pressure
gradient was set to zero. This gave a boundary layer thickness So at the
beginning of the rough surface of approximately 48 mm and a momentum
thickness Reynolds number i$ of about 3OOO. At the end of the first 1.22 m
of roughness the boundary layer was found to be nearly self-preserving with
the 99.5 % thickness3 equal to about 71 mm and a corrtsponding 1% of 430.
Thameasurements of u, w, and uw were made with an X-wire operated by
nonlinearized constant temperature anemometers. Tke anemometer outputs
were amplified, filtered by sharp cut-off low pass filters set at I kHz and
digitized at a sampling rate of 3 kHz on the digital data acquisition facility
mentioned in I. Final processing of the data was done on the English Electric
KDF9 computer in the Basser Computing Laboratory at the University of
Sydney. All digital records were analyzed for a duration of approximately
10 s. This was adequate to yield a standard deviation of about 10 % for the
third and fourth moments presented in Section 3, and also for most of the
spectral estimates (obtained via the FFT technique) of Section 5.
3. SKEWNESS AND FLATNESS FACTORS OF U, W AND UW
The skewness and flatness factors of an instantaneous quantity e are
S = 7/(2ria and F = e /(e )
The skewness and flatness factors of the streamwise and normal velocity
fluctuations u, w, and of uw - z, the fluctuations in Reynolds shear stress
with respect to the mean %, have been measured across the internal layer
for both the smooth to rough and the rough to smooth surface changes. For
the smooth to rough change the distributions are shown in Figs. 1 and 2 for
x/S, = 2.10 (closed symbols) and 3.14 (open symbol), where x is measured
downstream from the step change and 6,, is the smooth wall boundary layer
thickness at x = 0 (6, C= 4.82 cm). The distributions of F,, F,, and F, in
Fig. 1 are closely similar at the two stationa when plotted a m s t z/6,, where
6, is the internil layer thickness determined in I from both mean velocity and
Reynolds stress profiles (6, c* 0.88 cm at x/ii0 = 2.10 and 1.14 an at x/6, =
3.14 cm). This suggests that 6, is a physically significant h g t h scale in the
internal layer turbulence. The distributions of F, and F, increase to a maximum valuftof about 3.50 near the edge of the internal layer. For z/S, > 1.0,
F, and F, decrease gradually to a level corraponding to that of the undisturbed smooth wall layer. Although not shown here, F,, F,, and F,,
defined as
7 7 2
’ Note that this is also the valw of 8, used in the following wtima in the context of the
rough to smooth case.