

STATISTICAL ANALYSIS OF WALL TURBULENCE PHENOMENA
257
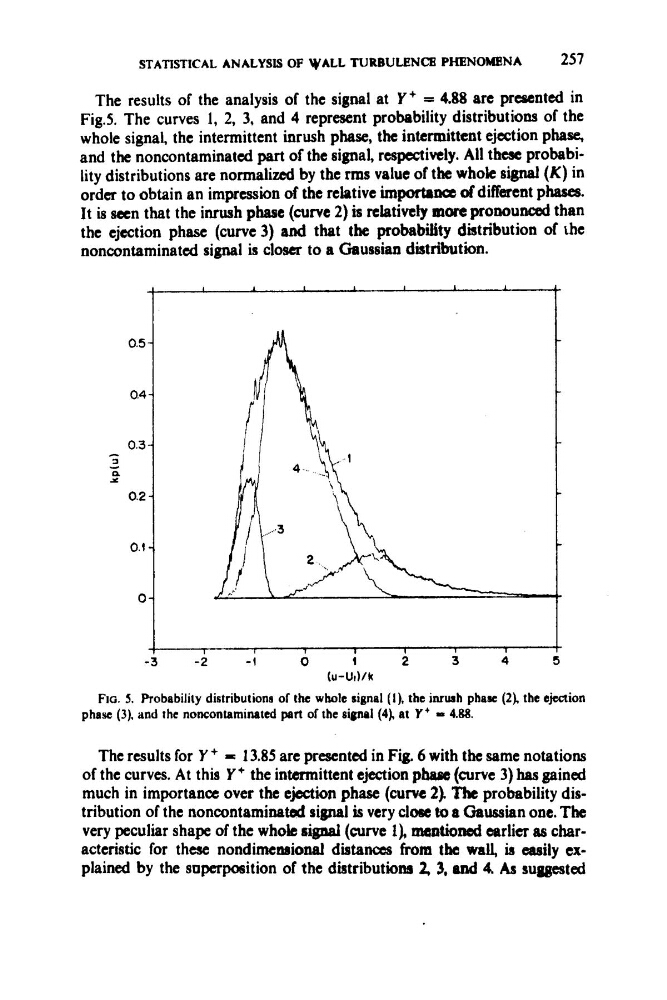
The results of the analysis of the signal at Y + = 4.88 are preocntcd in
Fig.5. The curves 1, 2, 3, and 4 represent probability distributions of the
whole signal, the intermittent inrush phase, the intermittent ejection phase,
and the noncontaminatcd part of the signal, respectively. All these probability distributions are normalized by the rms value of the whole signal (K) in
order to obtain an impression of the relative importam of different phases.
It is seen that the inrush phase (curve 2) is relatively more pronounced than
the ejection phase (curve 3) iand that the probabilSty distribution of the
noncontaminated signal is closer to a Gaussian distribution.
0.5
0.4
0.3
-
3
x
d
n
0.2
0. f
0
I
1
1
I
1
I
1
-3
- 2
- 1
0
1
2
3
4
(u-Ui)/k
Ro. 5. Probability distributions of the whole signal (I), the inrwh phase (21 the ejection
phase (3). and the noncontaminated part of the signal (4), at Y ' = 4.88.
The results for Y + = 13.85 are presented in Fig. 6 with the same notations
of the curves. At this Y
+
the intermittent ejection pham (curve 3) has gained
much in importance over the ejection phase ( c u m 2) The probability distribution of the noncontaminated signal is very close to a Gaussian one. The
very peculiar shape of the whole signal (curve l), mentioned earlier as characteristic for these nondimenrrional distances from the wall, is easily cxplained by the superposition of the distributions 2 , 3, ond 4. As suOgcsted
257
The results of the analysis of the signal at Y + = 4.88 are preocntcd in
Fig.5. The curves 1, 2, 3, and 4 represent probability distributions of the
whole signal, the intermittent inrush phase, the intermittent ejection phase,
and the noncontaminatcd part of the signal, respectively. All these probability distributions are normalized by the rms value of the whole signal (K) in
order to obtain an impression of the relative importam of different phases.
It is seen that the inrush phase (curve 2) is relatively more pronounced than
the ejection phase (curve 3) iand that the probabilSty distribution of the
noncontaminated signal is closer to a Gaussian distribution.
0.5
0.4
0.3
-
3
x
d
n
0.2
0. f
0
I
1
1
I
1
I
1
-3
- 2
- 1
0
1
2
3
4
(u-Ui)/k
Ro. 5. Probability distributions of the whole signal (I), the inrwh phase (21 the ejection
phase (3). and the noncontaminated part of the signal (4), at Y ' = 4.88.
The results for Y + = 13.85 are presented in Fig. 6 with the same notations
of the curves. At this Y
+
the intermittent ejection pham (curve 3) has gained
much in importance over the ejection phase ( c u m 2) The probability distribution of the noncontaminated signal is very close to a Gaussian one. The
very peculiar shape of the whole signal (curve l), mentioned earlier as characteristic for these nondimenrrional distances from the wall, is easily cxplained by the superposition of the distributions 2 , 3, ond 4. As suOgcsted