

STATISTICAL ANALYSIS OP WALL TURBULENCE PHENOMENA
l i
253
F
-
s
-
r
-
3
-
1
lo
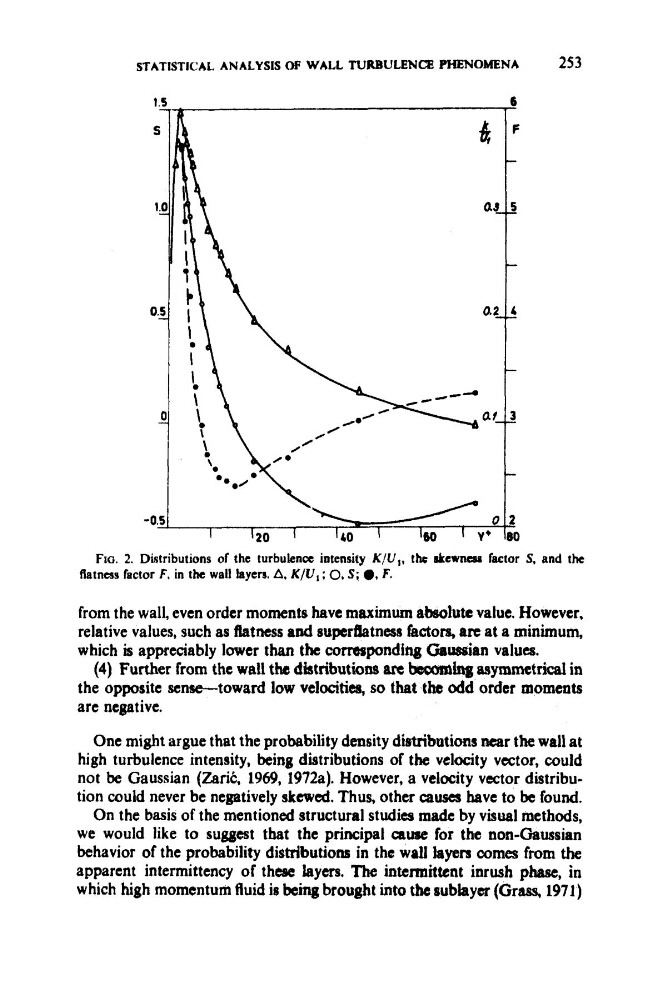
FIG. 2. Distributions of the turbulence intensity K/U,, the skewnew factor S. and the
flatness factor F, in the wall layers. A, K / U , : 0, S; 0, F.
from the wall, even order moments have maximum absolute value. However,
relative values, such as flatness and superflatness factors, are at a minimum,
which is appreciably lower than the c o m p o n d i u Gaussian values.
(4) Further from the wall the distributions are bwmllng asymmetrical in
the opposite sense-toward low velocith, so that the odd order moments
are negative.
One might argue that the probability density distributions near the wall at
high turbulence intensity, being distributions of the velocity vector, could
not be Gaussian (ZariC, 1969, 1972a). However, a velocity vector distribution could never bc negatively skewed. Thus, other causes have to be found.
On the basis of the mentioned structural studies made by visual methods,
we would like to suggest that the principal cause for the non-Gaussian
behavior of the probability distributions in the wolf layers comes from the
apparent intermittency of thoec layers. The intermittent inrush phase, in
which high momentum fluid is being brought inro the sublayer (Grass, 1971)
l i
253
F
-
s
-
r
-
3
-
1
lo
FIG. 2. Distributions of the turbulence intensity K/U,, the skewnew factor S. and the
flatness factor F, in the wall layers. A, K / U , : 0, S; 0, F.
from the wall, even order moments have maximum absolute value. However,
relative values, such as flatness and superflatness factors, are at a minimum,
which is appreciably lower than the c o m p o n d i u Gaussian values.
(4) Further from the wall the distributions are bwmllng asymmetrical in
the opposite sense-toward low velocith, so that the odd order moments
are negative.
One might argue that the probability density distributions near the wall at
high turbulence intensity, being distributions of the velocity vector, could
not be Gaussian (ZariC, 1969, 1972a). However, a velocity vector distribution could never bc negatively skewed. Thus, other causes have to be found.
On the basis of the mentioned structural studies made by visual methods,
we would like to suggest that the principal cause for the non-Gaussian
behavior of the probability distributions in the wolf layers comes from the
apparent intermittency of thoec layers. The intermittent inrush phase, in
which high momentum fluid is being brought inro the sublayer (Grass, 1971)