

MOI)F.I.INC; THE ATMOSPHEHM' HOl.INIlARY LAYER
205
depth z I was the relcvant length for scaling vertical distrihutions. A stability
index is :,,L. where L= --u:T,;gkQ,. the Monin-Obukhov length. The
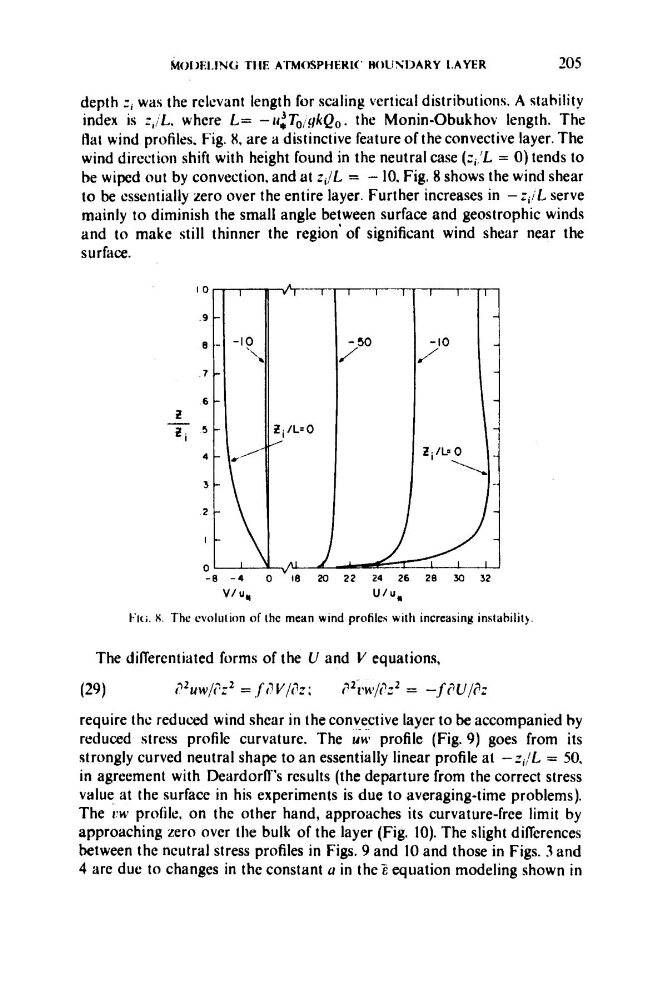
Hat wind profiles. Fig. 8, are a distinctive feature of the convective layer. The
wind direction shift with height found in the neutral case (zi,'L = 0) tends to
be wiped out by convection. and at q / L = - 10, Fig. 8 shows the wind shear
to be essentially zero over the entire layer. Further increases in - q ; L serve
mainly to diminish the small angle between surface and geostrophic winds
and to make still thinner the region'of significant wind shear near the
surface.
-h---TEi/L.O
,
-8 - 4
0
I8 20 22 24 26 28 30 32
v/ u*
u / u *
t i t i , X. The evolution of thc mean wind profiles with increasin8 instahitit)
The differentiated forms of the U and I/ equations,
(29)
?2uw/1':2 = f'17 v/&; ?2iw/?:2 = - f ?u/?z
require thc reduced wind shcar in the convective layer to be accompanied by
reduced stress profile curvature. The u-ni profile (Fig. 9) goes from its
strongly curved neutral shape to an essentially linear profile at - z J L = 50.
in agreement with Deardorfl's results (the departure from the correct stress
value at the surface in his experiments is due to averaging-time problems).
The t'w profile, on thc other hand, approaches its curvature-free limit by
approaching zero over the bulk of the layer (Fig. 10). The slight differences
between the ncutral stress profiles in Figs. 9 and 10 and those in Figs. 3 and
4 are due to changes in the constant a in the2 equation modeling shown in
205
depth z I was the relcvant length for scaling vertical distrihutions. A stability
index is :,,L. where L= --u:T,;gkQ,. the Monin-Obukhov length. The
Hat wind profiles. Fig. 8, are a distinctive feature of the convective layer. The
wind direction shift with height found in the neutral case (zi,'L = 0) tends to
be wiped out by convection. and at q / L = - 10, Fig. 8 shows the wind shear
to be essentially zero over the entire layer. Further increases in - q ; L serve
mainly to diminish the small angle between surface and geostrophic winds
and to make still thinner the region'of significant wind shear near the
surface.
-h---TEi/L.O
,
-8 - 4
0
I8 20 22 24 26 28 30 32
v/ u*
u / u *
t i t i , X. The evolution of thc mean wind profiles with increasin8 instahitit)
The differentiated forms of the U and I/ equations,
(29)
?2uw/1':2 = f'17 v/&; ?2iw/?:2 = - f ?u/?z
require thc reduced wind shcar in the convective layer to be accompanied by
reduced stress profile curvature. The u-ni profile (Fig. 9) goes from its
strongly curved neutral shape to an essentially linear profile at - z J L = 50.
in agreement with Deardorfl's results (the departure from the correct stress
value at the surface in his experiments is due to averaging-time problems).
The t'w profile, on thc other hand, approaches its curvature-free limit by
approaching zero over the bulk of the layer (Fig. 10). The slight differences
between the ncutral stress profiles in Figs. 9 and 10 and those in Figs. 3 and
4 are due to changes in the constant a in the2 equation modeling shown in