

VERTICAL. WIND COMPONENT
127
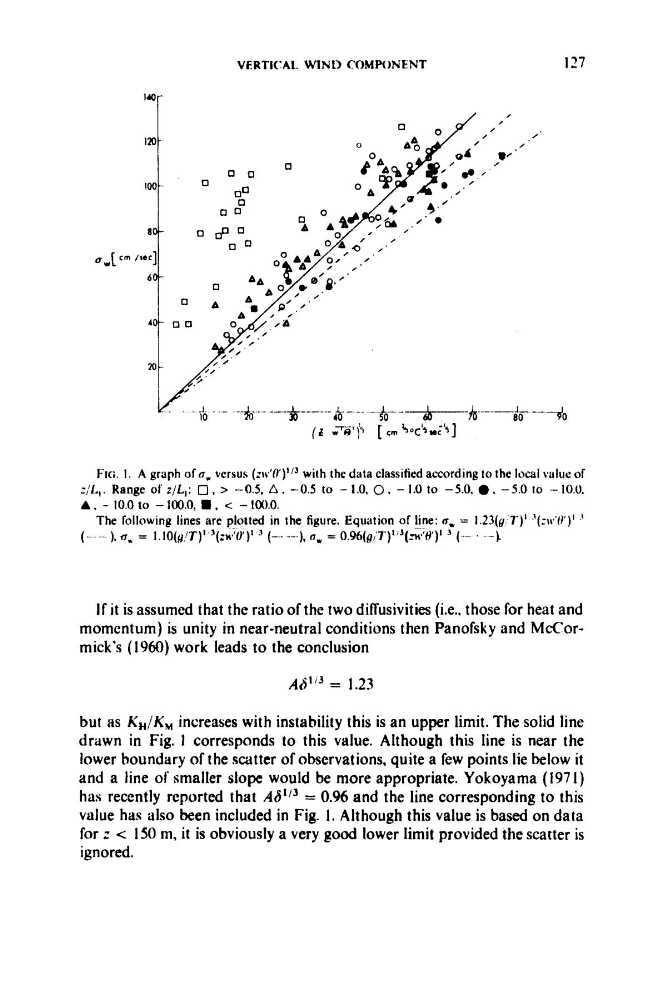
Fici. I . A graph of ow versus (zIv'O')~'~ with the data classified according to the local value of
z,'L,. Range of zlL,: 0 , > -0.5. 0. -0.5 to - 1.0, 0 , - 1.0 to -5.0, 0 . -5.0 to - 10.0.
The following lines are plotted in the figure. Equation of line: t r , = 1.23(y:T)' '(.-w'H')' '
A . - 10.0 to - 100.0, m , < - 100.0.
(-..-) . 0, = l . I O ( ~ ! T ) " ' ( ( ; ~ ~ ~ ~ ~ ) '
(-- ---), ow = 0,96(giT)1'3(&:'tl')l ' (-- . ~ - ) .
If it is assumed that the ratio of the two diffusivities (i.e., those for heat and
momentum) is unity in near-neutral conditions then Panofsky and McCormick's (1960) work leads to the conclusion
= 1.23
but as KH/KM increases with instability this is an upper limit. The solid line
druwn in Fig. 1 corresponds to this value. Although this line is near the
lower boundary of the scatter of observations, quite a few points lie below it
and a line of smaller slope would be more appropriate. Yokoyama (1971)
has recently reported that A6*13 = 0.96 and the line corresponding to this
value has also been included in Fig. 1. Although this value is based on data
for z < 150 m, it is obviously a very good lower limit provided the scatter is
ignored.
127
Fici. I . A graph of ow versus (zIv'O')~'~ with the data classified according to the local value of
z,'L,. Range of zlL,: 0 , > -0.5. 0. -0.5 to - 1.0, 0 , - 1.0 to -5.0, 0 . -5.0 to - 10.0.
The following lines are plotted in the figure. Equation of line: t r , = 1.23(y:T)' '(.-w'H')' '
A . - 10.0 to - 100.0, m , < - 100.0.
(-..-) . 0, = l . I O ( ~ ! T ) " ' ( ( ; ~ ~ ~ ~ ~ ) '
(-- ---), ow = 0,96(giT)1'3(&:'tl')l ' (-- . ~ - ) .
If it is assumed that the ratio of the two diffusivities (i.e., those for heat and
momentum) is unity in near-neutral conditions then Panofsky and McCormick's (1960) work leads to the conclusion
= 1.23
but as KH/KM increases with instability this is an upper limit. The solid line
druwn in Fig. 1 corresponds to this value. Although this line is near the
lower boundary of the scatter of observations, quite a few points lie below it
and a line of smaller slope would be more appropriate. Yokoyama (1971)
has recently reported that A6*13 = 0.96 and the line corresponding to this
value has also been included in Fig. 1. Although this value is based on data
for z < 150 m, it is obviously a very good lower limit provided the scatter is
ignored.