

I1EAI' TRANSFER A N D TURBULENT MIXING LAYERS
+.
- 0.2
-0.1
99
p *
.. 1
*.
0,1
0.2
1
0
6. MEASUREMENTS OF FLUCTUATING QUANTITIES
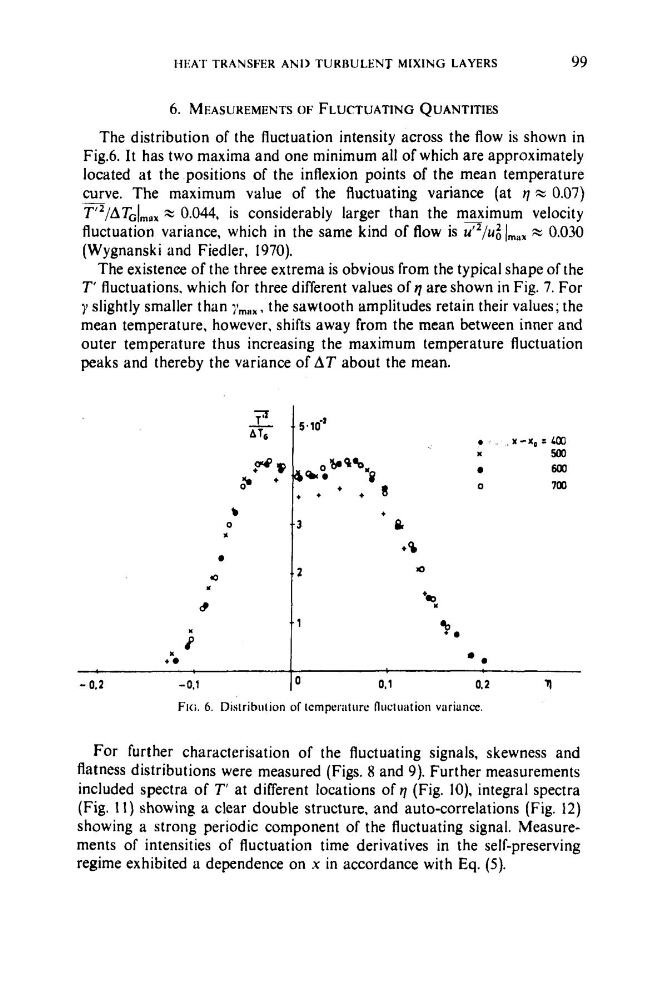
The distribution of the fluctuation intensity across the flow is shown in
Fig.6. It has two maxima and one minimum all of which are approximately
located at the positions of the inflexion points of the mean temperature
curve. The maximum value of the fluctuating variance (at q zz 0.07)
T2/ATGImDx x 0.044, is considerably larger than the maximum velocity
fluctuation variance, which in the same kind of flow is .l'/ui Jmax x 0.030
(Wygnanski and Fiedler. 1970).
The existence of the three extrema is obvious from the typical shape of the
T' fluctuations, which for three different values of q are shown i n Fig. 7. For
y slightly smaller than ymax, the sawtooth amplitudes retain their values; the
mean temperature, however, shifts away from the mean between inner and
outer temperature thus increasing the maximum temperature fluctuation
peaks and thereby the variance of AT about the mean.
-
5 . d
I
+ a
*%
1 : *)
a
x - Y o = L o o
X
500
600
0
700
For further characterisation of the fluctuating signals, skewness and
flatness distributions were measured (Figs. 8 and 9). Further measurements
included spectra of T' at different locations of q (Fig. 10). integral spectra
(Fig. 1 1 ) showing a clear double structure, and auto-correlations (Fig. 12)
showing a strong periodic component of the fluctuating signal. Measurements of intensities of fluctuation time derivatives in the self-preserving
regime exhibited a dependence on x in accordance with Eq. (5).
+.
- 0.2
-0.1
99
p *
.. 1
*.
0,1
0.2
1
0
6. MEASUREMENTS OF FLUCTUATING QUANTITIES
The distribution of the fluctuation intensity across the flow is shown in
Fig.6. It has two maxima and one minimum all of which are approximately
located at the positions of the inflexion points of the mean temperature
curve. The maximum value of the fluctuating variance (at q zz 0.07)
T2/ATGImDx x 0.044, is considerably larger than the maximum velocity
fluctuation variance, which in the same kind of flow is .l'/ui Jmax x 0.030
(Wygnanski and Fiedler. 1970).
The existence of the three extrema is obvious from the typical shape of the
T' fluctuations, which for three different values of q are shown i n Fig. 7. For
y slightly smaller than ymax, the sawtooth amplitudes retain their values; the
mean temperature, however, shifts away from the mean between inner and
outer temperature thus increasing the maximum temperature fluctuation
peaks and thereby the variance of AT about the mean.
-
5 . d
I
+ a
*%
1 : *)
a
x - Y o = L o o
X
500
600
0
700
For further characterisation of the fluctuating signals, skewness and
flatness distributions were measured (Figs. 8 and 9). Further measurements
included spectra of T' at different locations of q (Fig. 10). integral spectra
(Fig. 1 1 ) showing a clear double structure, and auto-correlations (Fig. 12)
showing a strong periodic component of the fluctuating signal. Measurements of intensities of fluctuation time derivatives in the self-preserving
regime exhibited a dependence on x in accordance with Eq. (5).