

200
400
500
600
700
800
900
1000
1000
1200
1400
Year
CO
2 concentration (ppm)
1600
1800
2000 2100
Observations
Projections
Scenarios
A1B
A1T
A1FI
A2
B1
B2
300
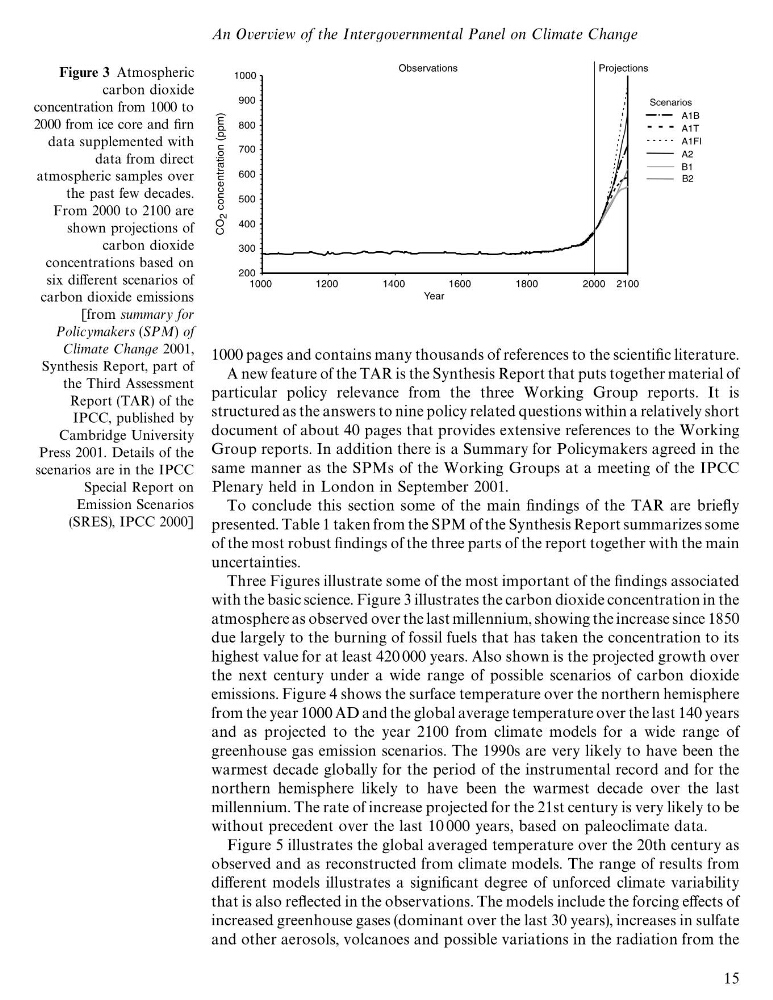
Figure 3 Atmospheric
carbon dioxide
concentration from 1000 to
2000 from ice core and firn
data supplemented with
data from direct
atmospheric samples over
the past few decades.
From 2000 to 2100 are
shown projections of
carbon dioxide
concentrations based on
six different scenarios of
carbon dioxide emissions
[from summary for
Policymakers (SPM) of
Climate Change 2001,
Synthesis Report, part of
the Third Assessment
Report (TAR) of the
IPCC, published by
Cambridge University
Press 2001. Details of the
scenarios are in the IPCC
Special Report on
Emission Scenarios
(SRES), IPCC 2000]
1000 pages and contains many thousands of references to the scientific literature.
A new feature of the TAR is the Synthesis Report that puts together material of
particular policy relevance from the three Working Group reports. It is
structured as the answers to nine policy related questions within a relatively short
document of about 40 pages that provides extensive references to the Working
Group reports. In addition there is a Summary for Policymakers agreed in the
same manner as the SPMs of the Working Groups at a meeting of the IPCC
Plenary held in London in September 2001.
To conclude this section some of the main findings of the TAR are briefly
presented. Table 1 taken from the SPM of the Synthesis Report summarizes some
of the most robust findings of the three parts of the report together with the main
uncertainties.
Three Figures illustrate some of the most important of the findings associated
with the basic science. Figure 3 illustrates the carbon dioxide concentration in the
atmosphere as observed over the last millennium, showing the increase since 1850
due largely to the burning of fossil fuels that has taken the concentration to its
highest value for at least 420 000 years. Also shown is the projected growth over
the next century under a wide range of possible scenarios of carbon dioxide
emissions. Figure 4 shows the surface temperature over the northern hemisphere
from the year 1000 AD and the global average temperature over the last 140 years
and as projected to the year 2100 from climate models for a wide range of
greenhouse gas emission scenarios. The 1990s are very likely to have been the
warmest decade globally for the period of the instrumental record and for the
northern hemisphere likely to have been the warmest decade over the last
millennium. The rate of increase projected for the 21st century is very likely to be
without precedent over the last 10 000 years, based on paleoclimate data.
Figure 5 illustrates the global averaged temperature over the 20th century as
observed and as reconstructed from climate models. The range of results from
different models illustrates a significant degree of unforced climate variability
that is also reflected in the observations. The models include the forcing effects of
increased greenhouse gases (dominant over the last 30 years), increases in sulfate
and other aerosols, volcanoes and possible variations in the radiation from the
An Overview of the Intergovernmental Panel on Climate Change
15
400
500
600
700
800
900
1000
1000
1200
1400
Year
CO
2 concentration (ppm)
1600
1800
2000 2100
Observations
Projections
Scenarios
A1B
A1T
A1FI
A2
B1
B2
300
Figure 3 Atmospheric
carbon dioxide
concentration from 1000 to
2000 from ice core and firn
data supplemented with
data from direct
atmospheric samples over
the past few decades.
From 2000 to 2100 are
shown projections of
carbon dioxide
concentrations based on
six different scenarios of
carbon dioxide emissions
[from summary for
Policymakers (SPM) of
Climate Change 2001,
Synthesis Report, part of
the Third Assessment
Report (TAR) of the
IPCC, published by
Cambridge University
Press 2001. Details of the
scenarios are in the IPCC
Special Report on
Emission Scenarios
(SRES), IPCC 2000]
1000 pages and contains many thousands of references to the scientific literature.
A new feature of the TAR is the Synthesis Report that puts together material of
particular policy relevance from the three Working Group reports. It is
structured as the answers to nine policy related questions within a relatively short
document of about 40 pages that provides extensive references to the Working
Group reports. In addition there is a Summary for Policymakers agreed in the
same manner as the SPMs of the Working Groups at a meeting of the IPCC
Plenary held in London in September 2001.
To conclude this section some of the main findings of the TAR are briefly
presented. Table 1 taken from the SPM of the Synthesis Report summarizes some
of the most robust findings of the three parts of the report together with the main
uncertainties.
Three Figures illustrate some of the most important of the findings associated
with the basic science. Figure 3 illustrates the carbon dioxide concentration in the
atmosphere as observed over the last millennium, showing the increase since 1850
due largely to the burning of fossil fuels that has taken the concentration to its
highest value for at least 420 000 years. Also shown is the projected growth over
the next century under a wide range of possible scenarios of carbon dioxide
emissions. Figure 4 shows the surface temperature over the northern hemisphere
from the year 1000 AD and the global average temperature over the last 140 years
and as projected to the year 2100 from climate models for a wide range of
greenhouse gas emission scenarios. The 1990s are very likely to have been the
warmest decade globally for the period of the instrumental record and for the
northern hemisphere likely to have been the warmest decade over the last
millennium. The rate of increase projected for the 21st century is very likely to be
without precedent over the last 10 000 years, based on paleoclimate data.
Figure 5 illustrates the global averaged temperature over the 20th century as
observed and as reconstructed from climate models. The range of results from
different models illustrates a significant degree of unforced climate variability
that is also reflected in the observations. The models include the forcing effects of
increased greenhouse gases (dominant over the last 30 years), increases in sulfate
and other aerosols, volcanoes and possible variations in the radiation from the
An Overview of the Intergovernmental Panel on Climate Change
15