

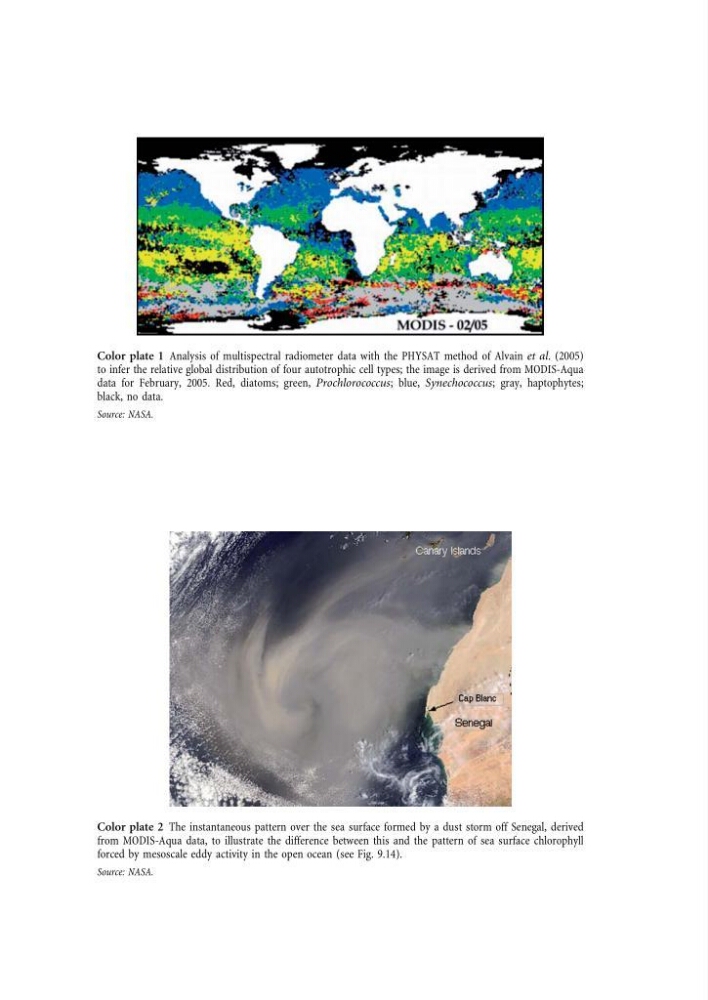
Color plate 1 Analysis of multispectral radiometer data with the PHYSAT method of Alvain et al. (2005)
to infer the relative global distribution of four autotrophic cell types; the image is derived from MODIS-Aqua
data for February, 2005. Red, diatoms; green, Prochlorococcus; blue, Synechococcus; gray, haptophytes;
black, no data.
Source: NASA.
Color plate 2 The instantaneous pattern over the sea surface formed by a dust storm off Senegal, derived
from MODIS-Aqua data, to illustrate the difference between this and the pattern of sea surface chlorophyll
forced by mesoscale eddy activity in the open ocean (see Fig. 9.14).
Source: NASA.
to infer the relative global distribution of four autotrophic cell types; the image is derived from MODIS-Aqua
data for February, 2005. Red, diatoms; green, Prochlorococcus; blue, Synechococcus; gray, haptophytes;
black, no data.
Source: NASA.
Color plate 2 The instantaneous pattern over the sea surface formed by a dust storm off Senegal, derived
from MODIS-Aqua data, to illustrate the difference between this and the pattern of sea surface chlorophyll
forced by mesoscale eddy activity in the open ocean (see Fig. 9.14).
Source: NASA.