

462
Chapter 12: The Southern Ocean
euphausiids, and schooling small fish and squid. But only aggregated prey is taken by
these as by other baleen whales.
Zooplankton aggregations attract also seabirds. Observed densities of 29 species, almost
all Procelliformes (petrels, shearwaters, prions), in the PFZ in the austral summer of
1995–96, varied from very small numbers up to 400 ind km
−2 (van Franeker et al., 2002).
Where mesoscale circulation engendered high values for phytoplankton productivity
and zooplankton abundance, aggregation of birds also occurred. This positive spatial
correlation between plankton ecology and bird numbers was functional in that broadbilled prions, the numerically dominant bird species, foraged on very small copepods
(Oithona spp.) that were aggregated in the frontal zones. Species that fed largely on squid
and fish showed a much weaker correlation with the details of mesoscale features: these
larger food organisms are much less passive tracers of water movement than are the
zooplankton.
Synopsis
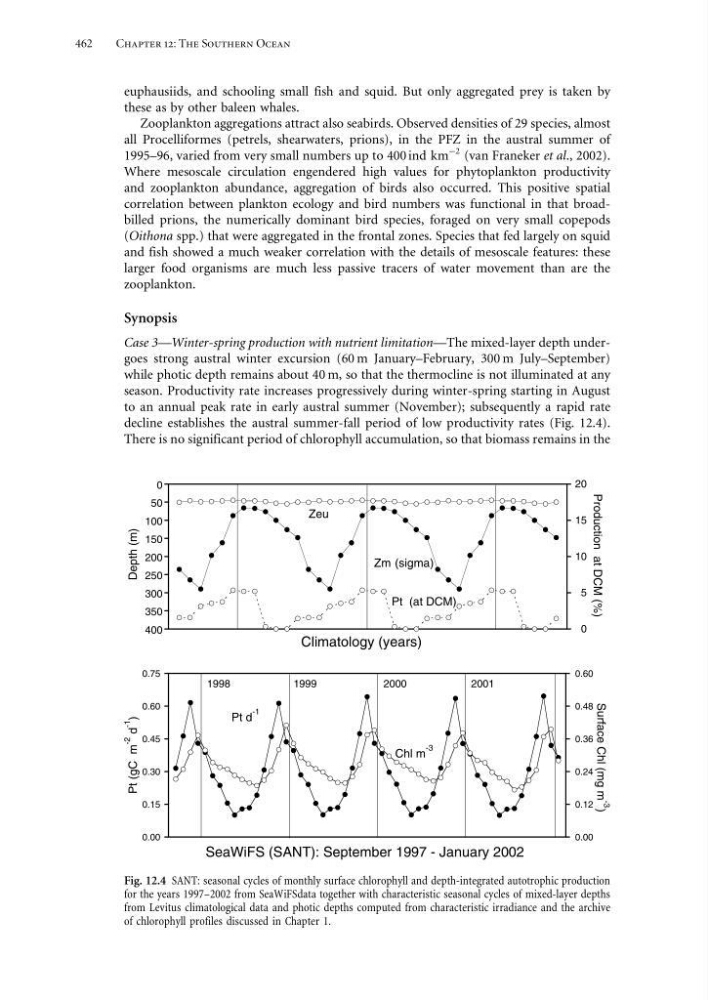
Case 3—Winter-spring production with nutrient limitation—The mixed-layer depth undergoes strong austral winter excursion (60 m January–February, 300 m July–September)
while photic depth remains about 40 m, so that the thermocline is not illuminated at any
season. Productivity rate increases progressively during winter-spring starting in August
to an annual peak rate in early austral summer (November); subsequently a rapid rate
decline establishes the austral summer-fall period of low productivity rates (Fig. 12.4).
There is no significant period of chlorophyll accumulation, so that biomass remains in the
0
50
100
150
200
250
300
350
400
0
5
10
15
20
Climatology (years)
Depth (m)
Production at DCM (%)
Zm (sigma)
Zeu
Pt (at DCM)
0.00
0.15
0.30
0.45
0.60
0.75
0.00
0.12
0.24
0.36
0.48
0.60
SeaWiFS (SANT): September 1997 - January 2002
Surface Chl (mg m -3
)
Pt d
-1
Chl m
-3
Pt (gC m
-2
d
-1
)
1998
1999
2000
2001
Fig. 12.4 SANT: seasonal cycles of monthly surface chlorophyll and depth-integrated autotrophic production
for the years 1997–2002 from SeaWiFSdata together with characteristic seasonal cycles of mixed-layer depths
from Levitus climatological data and photic depths computed from characteristic irradiance and the archive
of chlorophyll profiles discussed in Chapter 1.
Chapter 12: The Southern Ocean
euphausiids, and schooling small fish and squid. But only aggregated prey is taken by
these as by other baleen whales.
Zooplankton aggregations attract also seabirds. Observed densities of 29 species, almost
all Procelliformes (petrels, shearwaters, prions), in the PFZ in the austral summer of
1995–96, varied from very small numbers up to 400 ind km
−2 (van Franeker et al., 2002).
Where mesoscale circulation engendered high values for phytoplankton productivity
and zooplankton abundance, aggregation of birds also occurred. This positive spatial
correlation between plankton ecology and bird numbers was functional in that broadbilled prions, the numerically dominant bird species, foraged on very small copepods
(Oithona spp.) that were aggregated in the frontal zones. Species that fed largely on squid
and fish showed a much weaker correlation with the details of mesoscale features: these
larger food organisms are much less passive tracers of water movement than are the
zooplankton.
Synopsis
Case 3—Winter-spring production with nutrient limitation—The mixed-layer depth undergoes strong austral winter excursion (60 m January–February, 300 m July–September)
while photic depth remains about 40 m, so that the thermocline is not illuminated at any
season. Productivity rate increases progressively during winter-spring starting in August
to an annual peak rate in early austral summer (November); subsequently a rapid rate
decline establishes the austral summer-fall period of low productivity rates (Fig. 12.4).
There is no significant period of chlorophyll accumulation, so that biomass remains in the
0
50
100
150
200
250
300
350
400
0
5
10
15
20
Climatology (years)
Depth (m)
Production at DCM (%)
Zm (sigma)
Zeu
Pt (at DCM)
0.00
0.15
0.30
0.45
0.60
0.75
0.00
0.12
0.24
0.36
0.48
0.60
SeaWiFS (SANT): September 1997 - January 2002
Surface Chl (mg m -3
)
Pt d
-1
Chl m
-3
Pt (gC m
-2
d
-1
)
1998
1999
2000
2001
Fig. 12.4 SANT: seasonal cycles of monthly surface chlorophyll and depth-integrated autotrophic production
for the years 1997–2002 from SeaWiFSdata together with characteristic seasonal cycles of mixed-layer depths
from Levitus climatological data and photic depths computed from characteristic irradiance and the archive
of chlorophyll profiles discussed in Chapter 1.