

Pacific Coastal Biome
441
0.00
0.20
0.40
0.60
0.80
1.00
0.10
0.20
0.30
0.40
0.50
0.60
SeaWiFS (NEWZ): September 1997 - January 2002
Surface Chl (mg m -3
)
Pt d
-1
Chl m
-3
Pt (gC m
-2
d
-1
)
1998
1999
2000
2001
0
50
100
150
200
250
300
0
5
10
15
20
Climatology (years)
Depth (m)
Production at DCM (%)
Zm (sigma)
Zeu
Pt (at DCM)
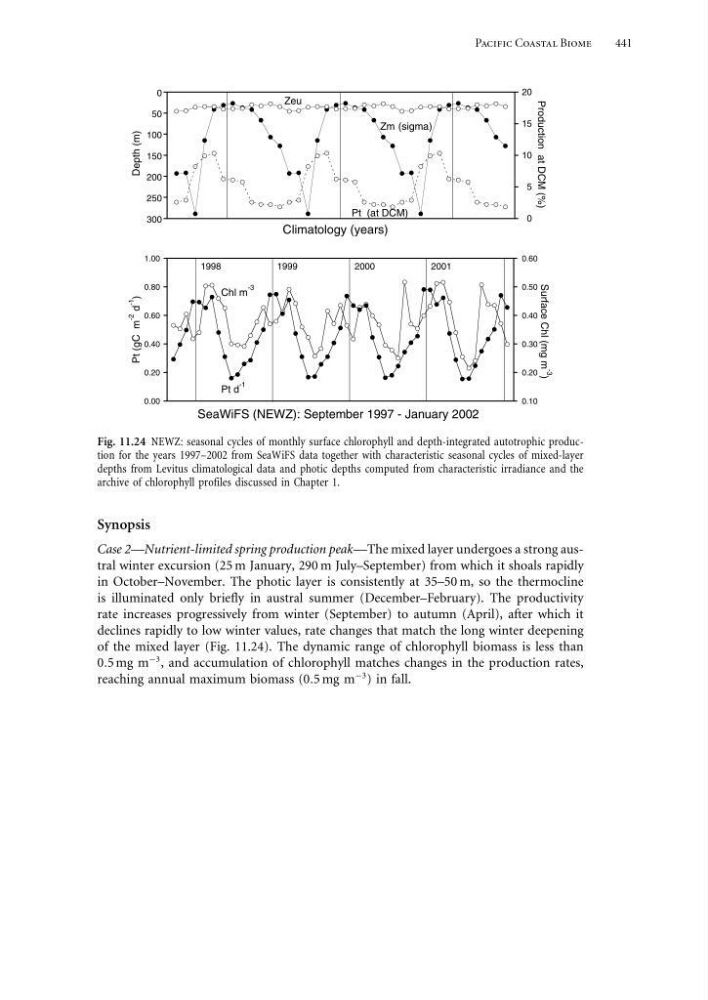
Fig. 11.24 NEWZ: seasonal cycles of monthly surface chlorophyll and depth-integrated autotrophic production for the years 1997–2002 from SeaWiFS data together with characteristic seasonal cycles of mixed-layer
depths from Levitus climatological data and photic depths computed from characteristic irradiance and the
archive of chlorophyll profiles discussed in Chapter 1.
Synopsis
Case 2—Nutrient-limited spring production peak—The mixed layer undergoes a strong austral winter excursion (25 m January, 290 m July–September) from which it shoals rapidly
in October–November. The photic layer is consistently at 35–50 m, so the thermocline
is illuminated only briefly in austral summer (December–February). The productivity
rate increases progressively from winter (September) to autumn (April), after which it
declines rapidly to low winter values, rate changes that match the long winter deepening
of the mixed layer (Fig. 11.24). The dynamic range of chlorophyll biomass is less than
05 mg m
−3 , and accumulation of chlorophyll matches changes in the production rates,
reaching annual maximum biomass (05 mg m
−3 ) in fall.
441
0.00
0.20
0.40
0.60
0.80
1.00
0.10
0.20
0.30
0.40
0.50
0.60
SeaWiFS (NEWZ): September 1997 - January 2002
Surface Chl (mg m -3
)
Pt d
-1
Chl m
-3
Pt (gC m
-2
d
-1
)
1998
1999
2000
2001
0
50
100
150
200
250
300
0
5
10
15
20
Climatology (years)
Depth (m)
Production at DCM (%)
Zm (sigma)
Zeu
Pt (at DCM)
Fig. 11.24 NEWZ: seasonal cycles of monthly surface chlorophyll and depth-integrated autotrophic production for the years 1997–2002 from SeaWiFS data together with characteristic seasonal cycles of mixed-layer
depths from Levitus climatological data and photic depths computed from characteristic irradiance and the
archive of chlorophyll profiles discussed in Chapter 1.
Synopsis
Case 2—Nutrient-limited spring production peak—The mixed layer undergoes a strong austral winter excursion (25 m January, 290 m July–September) from which it shoals rapidly
in October–November. The photic layer is consistently at 35–50 m, so the thermocline
is illuminated only briefly in austral summer (December–February). The productivity
rate increases progressively from winter (September) to autumn (April), after which it
declines rapidly to low winter values, rate changes that match the long winter deepening
of the mixed layer (Fig. 11.24). The dynamic range of chlorophyll biomass is less than
05 mg m
−3 , and accumulation of chlorophyll matches changes in the production rates,
reaching annual maximum biomass (05 mg m
−3 ) in fall.