

370
Chapter 11: The Pacific Ocean
enrichment. Moreover, as already noted, the enrichment of surface water in NO 3 is
highly asymmetric about the equator and is very abruptly terminated northward at the
EQF. The long waves that occur in the frontal systems here are tracked by chlorophyll
biomass, readily observed both by satellite and also by moored EqPac instruments that lay
within the field covered by the waves (Foley et al., 1997). The onset of the ENSO warm
event in September 1991 occurred as a series of wind reversals that induced eastwardpropagating Kelvin waves, associated with downwelling pulses, zonally across the PEQD
province (Kessler and McPhaden, 1995). The process peaked before the first survey of
February–March 1992, so that the second survey, 6 months later, was undertaken during
the recovery phase, when upwelling was renewed, and after the nutrients thus supplied
had initiated a strong bloom (Barber et al., 1996; McCarthy et al., 1996).
The NOAA EqPac surveys also produced one of the few modern spatially extensive data
sets of phytoplankton characteristics, so that the relations between these and the oceanic
environment could be established (Chavez et al., 1996). The area covered by this survey
closely matched the boundaries of PEQD. The data from the five meridional transects
suggest values for integrated chlorophyll for the year 1992 of 25–30 mg m
−2 for PEQD
from 110
W to 170
W and for integrated primary production of 650–950 mg C m
−2 d
−1 .
The production values are rather higher than those calculated for PEQD for 1997–2001
from SeaWiFS data, although the chlorophyll values are very close. The biomass of fractions of autotrophic cells was relatively constant from 110
W to 170
W (each expressed
as g C liter
−1 ): Synechococcus, 0.9–2.9; eukaryotic picoplankton, 0.5–5.0; haptophytes,
2.1–3.0; dinoflagellates, 3.7–10.7; pennate diatoms, 0.5–11.7; centric diatoms, 0.2–2.7; and
ciliates with sequestered chloroplasts, 0.001–0.01. Chlorophyll biomass and production
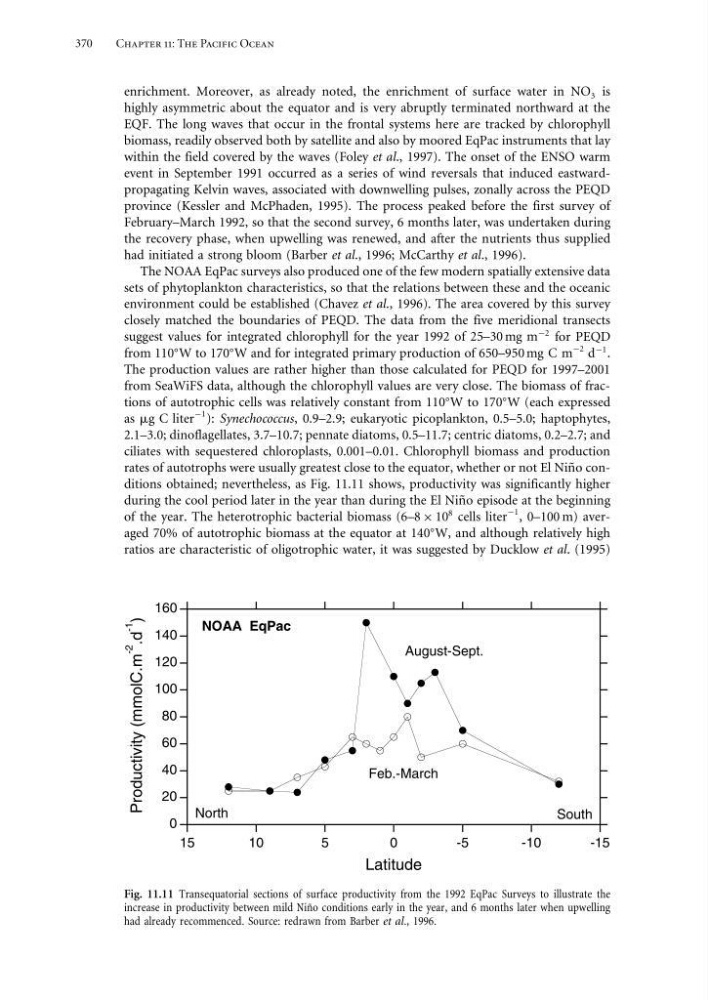
rates of autotrophs were usually greatest close to the equator, whether or not El Niño conditions obtained; nevertheless, as Fig. 11.11 shows, productivity was significantly higher
during the cool period later in the year than during the El Niño episode at the beginning
of the year. The heterotrophic bacterial biomass (6–8 × 10
8 cells liter
−1 , 0–100 m) averaged 70% of autotrophic biomass at the equator at 140
W, and although relatively high
ratios are characteristic of oligotrophic water, it was suggested by Ducklow et al. (1995)
0
20
40
60
80
100
120
140
160
-15
-10
-5
0
5
10
15
Productivity (mmolC.m
-2
.d
-1
)
Latitude
August-Sept.
Feb.-March
NOAA EqPac
North
South
Fig. 11.11 Transequatorial sections of surface productivity from the 1992 EqPac Surveys to illustrate the
increase in productivity between mild Niño conditions early in the year, and 6 months later when upwelling
had already recommenced. Source: redrawn from Barber et al., 1996.
Chapter 11: The Pacific Ocean
enrichment. Moreover, as already noted, the enrichment of surface water in NO 3 is
highly asymmetric about the equator and is very abruptly terminated northward at the
EQF. The long waves that occur in the frontal systems here are tracked by chlorophyll
biomass, readily observed both by satellite and also by moored EqPac instruments that lay
within the field covered by the waves (Foley et al., 1997). The onset of the ENSO warm
event in September 1991 occurred as a series of wind reversals that induced eastwardpropagating Kelvin waves, associated with downwelling pulses, zonally across the PEQD
province (Kessler and McPhaden, 1995). The process peaked before the first survey of
February–March 1992, so that the second survey, 6 months later, was undertaken during
the recovery phase, when upwelling was renewed, and after the nutrients thus supplied
had initiated a strong bloom (Barber et al., 1996; McCarthy et al., 1996).
The NOAA EqPac surveys also produced one of the few modern spatially extensive data
sets of phytoplankton characteristics, so that the relations between these and the oceanic
environment could be established (Chavez et al., 1996). The area covered by this survey
closely matched the boundaries of PEQD. The data from the five meridional transects
suggest values for integrated chlorophyll for the year 1992 of 25–30 mg m
−2 for PEQD
from 110
W to 170
W and for integrated primary production of 650–950 mg C m
−2 d
−1 .
The production values are rather higher than those calculated for PEQD for 1997–2001
from SeaWiFS data, although the chlorophyll values are very close. The biomass of fractions of autotrophic cells was relatively constant from 110
W to 170
W (each expressed
as g C liter
−1 ): Synechococcus, 0.9–2.9; eukaryotic picoplankton, 0.5–5.0; haptophytes,
2.1–3.0; dinoflagellates, 3.7–10.7; pennate diatoms, 0.5–11.7; centric diatoms, 0.2–2.7; and
ciliates with sequestered chloroplasts, 0.001–0.01. Chlorophyll biomass and production
rates of autotrophs were usually greatest close to the equator, whether or not El Niño conditions obtained; nevertheless, as Fig. 11.11 shows, productivity was significantly higher
during the cool period later in the year than during the El Niño episode at the beginning
of the year. The heterotrophic bacterial biomass (6–8 × 10
8 cells liter
−1 , 0–100 m) averaged 70% of autotrophic biomass at the equator at 140
W, and although relatively high
ratios are characteristic of oligotrophic water, it was suggested by Ducklow et al. (1995)
0
20
40
60
80
100
120
140
160
-15
-10
-5
0
5
10
15
Productivity (mmolC.m
-2
.d
-1
)
Latitude
August-Sept.
Feb.-March
NOAA EqPac
North
South
Fig. 11.11 Transequatorial sections of surface productivity from the 1992 EqPac Surveys to illustrate the
increase in productivity between mild Niño conditions early in the year, and 6 months later when upwelling
had already recommenced. Source: redrawn from Barber et al., 1996.