

366
Chapter 11: The Pacific Ocean
oxygen-depleted (< 10 ml liter
−1 ) zone. Individual predator species had characteristic
distributions in each of these depth zones. The overall number of species was greatest
in the pycnocline, where greatest stability (Brunt-Väisälä frequency <30 cph) favored
niche specialization among species groups both within genera and between related genera. Comparison of these data with 84 LHPR profiles obtained during the EASTROPAC
surveys show that it is permissible to extrapolate from BIOSTAT over the entire eastern
region, at least, of the PNEC province; the relations between depths of features of the
mesozooplankton profile, of the MLD, and of the DCM are entirely predictable: significant correlation is obtained between the depth of the mesozooplankton maximum,
mixed-layer depth, and the DCM across this region (Longhurst, 1976).
A curiosity of this province is the distribution of the cladoceran Evadne in the oceanic
domain although this is usually considered to be a neritic genus. The EASTROPAC and
other survey data show that both E. tergestina and E. spinifera are widely distributed in
both NPTG and PNEC provinces and, while avoiding the equatorial divergence, are again
found in the SPSG province to the south (Longhurst and Seibert, 1972). They occur mostly
close to the surface (0–20 m) and are generally thought to consume bacterioplankton in
preference to autotrophic cells.
We are not surprised to find that higher trophic level organisms respond to the distribution of mesozooplankton biomass—and hence to physical forcing—in an appropriate
manner. Ichii et al. (2002) recently analyzed the distribution of “jumbo flying squid”
(Dosidocus gigas) taken in this province by commercial fisheries. When the countercurrent is well developed, as it was in autumn 1997, active upwelling occurs along the
0.25
0.30
0.35
0.40
0.45
0.50
0.10
0.15
0.20
0.25
0.30
0.35
SeaWiFS (PNEC): September 1997 - January 2002
Surface Chl (mg m -3
)
Pt d
-1
Chl m
-3
Pt (gC m
-2
d
-1
)
1998
1999
2000
2001
0
20
40
60
80
100
120
0
5
10
15
20
25
Climatology (years)
Depth (m)
Production at DCM (%)
Zm (sigma)
Zeu
Pt (at DCM)
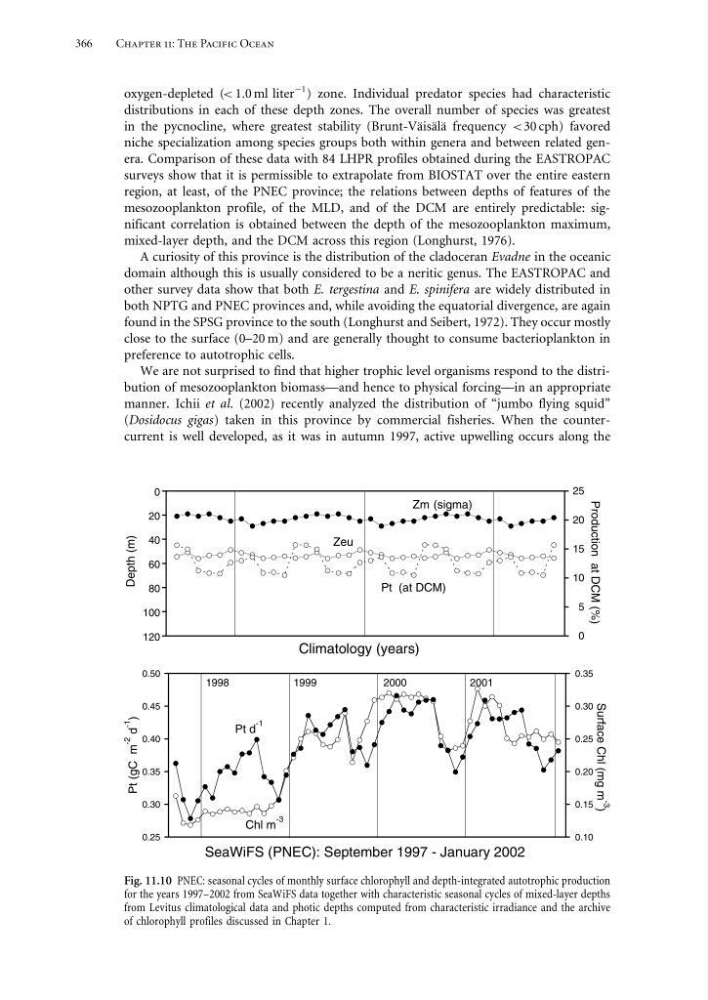
Fig. 11.10 PNEC: seasonal cycles of monthly surface chlorophyll and depth-integrated autotrophic production
for the years 1997–2002 from SeaWiFS data together with characteristic seasonal cycles of mixed-layer depths
from Levitus climatological data and photic depths computed from characteristic irradiance and the archive
of chlorophyll profiles discussed in Chapter 1.
Chapter 11: The Pacific Ocean
oxygen-depleted (< 10 ml liter
−1 ) zone. Individual predator species had characteristic
distributions in each of these depth zones. The overall number of species was greatest
in the pycnocline, where greatest stability (Brunt-Väisälä frequency <30 cph) favored
niche specialization among species groups both within genera and between related genera. Comparison of these data with 84 LHPR profiles obtained during the EASTROPAC
surveys show that it is permissible to extrapolate from BIOSTAT over the entire eastern
region, at least, of the PNEC province; the relations between depths of features of the
mesozooplankton profile, of the MLD, and of the DCM are entirely predictable: significant correlation is obtained between the depth of the mesozooplankton maximum,
mixed-layer depth, and the DCM across this region (Longhurst, 1976).
A curiosity of this province is the distribution of the cladoceran Evadne in the oceanic
domain although this is usually considered to be a neritic genus. The EASTROPAC and
other survey data show that both E. tergestina and E. spinifera are widely distributed in
both NPTG and PNEC provinces and, while avoiding the equatorial divergence, are again
found in the SPSG province to the south (Longhurst and Seibert, 1972). They occur mostly
close to the surface (0–20 m) and are generally thought to consume bacterioplankton in
preference to autotrophic cells.
We are not surprised to find that higher trophic level organisms respond to the distribution of mesozooplankton biomass—and hence to physical forcing—in an appropriate
manner. Ichii et al. (2002) recently analyzed the distribution of “jumbo flying squid”
(Dosidocus gigas) taken in this province by commercial fisheries. When the countercurrent is well developed, as it was in autumn 1997, active upwelling occurs along the
0.25
0.30
0.35
0.40
0.45
0.50
0.10
0.15
0.20
0.25
0.30
0.35
SeaWiFS (PNEC): September 1997 - January 2002
Surface Chl (mg m -3
)
Pt d
-1
Chl m
-3
Pt (gC m
-2
d
-1
)
1998
1999
2000
2001
0
20
40
60
80
100
120
0
5
10
15
20
25
Climatology (years)
Depth (m)
Production at DCM (%)
Zm (sigma)
Zeu
Pt (at DCM)
Fig. 11.10 PNEC: seasonal cycles of monthly surface chlorophyll and depth-integrated autotrophic production
for the years 1997–2002 from SeaWiFS data together with characteristic seasonal cycles of mixed-layer depths
from Levitus climatological data and photic depths computed from characteristic irradiance and the archive
of chlorophyll profiles discussed in Chapter 1.