

Pacific Westerly Winds Biome
353
depth is such that the pycnocline is illuminated for 1–2 months longer in NPST than
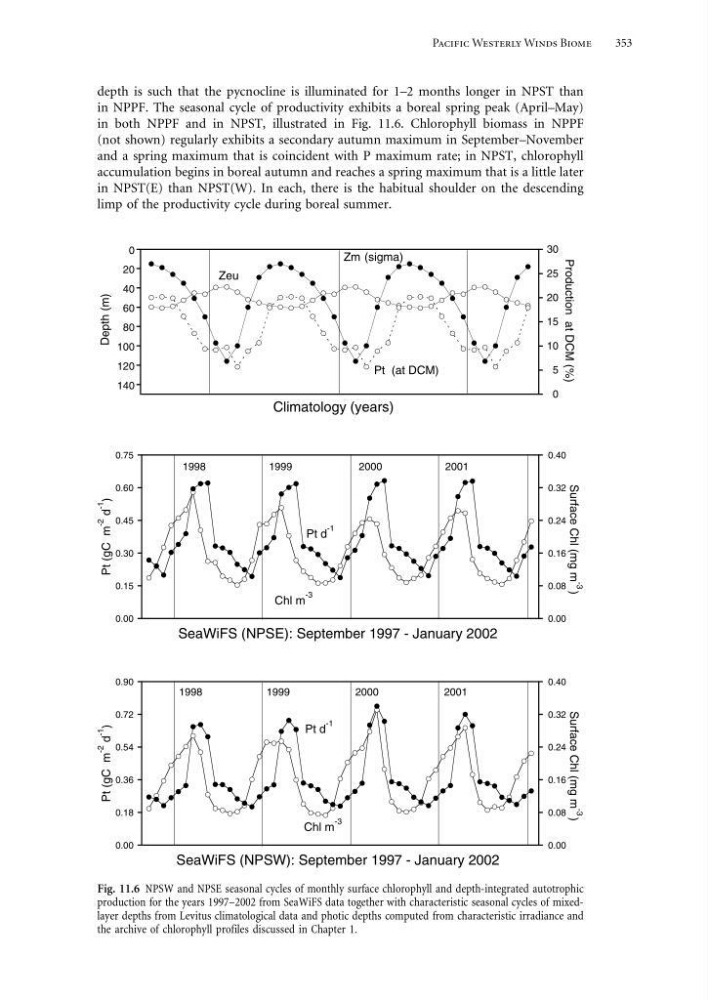
in NPPF. The seasonal cycle of productivity exhibits a boreal spring peak (April–May)
in both NPPF and in NPST, illustrated in Fig. 11.6. Chlorophyll biomass in NPPF
(not shown) regularly exhibits a secondary autumn maximum in September–November
and a spring maximum that is coincident with P maximum rate; in NPST, chlorophyll
accumulation begins in boreal autumn and reaches a spring maximum that is a little later
in NPST(E) than NPST(W). In each, there is the habitual shoulder on the descending
limp of the productivity cycle during boreal summer.
0
20
40
60
80
100
120
140
0
5
10
15
20
25
30
Climatology (years)
Depth (m)
Production at DCM (%)
Zm (sigma)
Zeu
Pt (at DCM)
0.00
0.15
0.30
0.45
0.60
0.75
0.00
0.08
0.16
0.24
0.32
0.40
SeaWiFS (NPSE): September 1997 - January 2002
Surface Chl (mg m -3
)
Pt d
-1
Chl m
-3
Pt (gC m
-2
d
-1
)
1998
1999
2000
2001
0.00
0.18
0.36
0.54
0.72
0.90
0.00
0.08
0.16
0.24
0.32
0.40
SeaWiFS (NPSW): September 1997 - January 2002
Surface Chl (mg m -3
)
Pt d
-1
Chl m
-3
Pt (gC m
-2
d
-1
)
1998
1999
2001
2000
Fig. 11.6 NPSW and NPSE seasonal cycles of monthly surface chlorophyll and depth-integrated autotrophic
production for the years 1997–2002 from SeaWiFS data together with characteristic seasonal cycles of mixedlayer depths from Levitus climatological data and photic depths computed from characteristic irradiance and
the archive of chlorophyll profiles discussed in Chapter 1.
353
depth is such that the pycnocline is illuminated for 1–2 months longer in NPST than
in NPPF. The seasonal cycle of productivity exhibits a boreal spring peak (April–May)
in both NPPF and in NPST, illustrated in Fig. 11.6. Chlorophyll biomass in NPPF
(not shown) regularly exhibits a secondary autumn maximum in September–November
and a spring maximum that is coincident with P maximum rate; in NPST, chlorophyll
accumulation begins in boreal autumn and reaches a spring maximum that is a little later
in NPST(E) than NPST(W). In each, there is the habitual shoulder on the descending
limp of the productivity cycle during boreal summer.
0
20
40
60
80
100
120
140
0
5
10
15
20
25
30
Climatology (years)
Depth (m)
Production at DCM (%)
Zm (sigma)
Zeu
Pt (at DCM)
0.00
0.15
0.30
0.45
0.60
0.75
0.00
0.08
0.16
0.24
0.32
0.40
SeaWiFS (NPSE): September 1997 - January 2002
Surface Chl (mg m -3
)
Pt d
-1
Chl m
-3
Pt (gC m
-2
d
-1
)
1998
1999
2000
2001
0.00
0.18
0.36
0.54
0.72
0.90
0.00
0.08
0.16
0.24
0.32
0.40
SeaWiFS (NPSW): September 1997 - January 2002
Surface Chl (mg m -3
)
Pt d
-1
Chl m
-3
Pt (gC m
-2
d
-1
)
1998
1999
2001
2000
Fig. 11.6 NPSW and NPSE seasonal cycles of monthly surface chlorophyll and depth-integrated autotrophic
production for the years 1997–2002 from SeaWiFS data together with characteristic seasonal cycles of mixedlayer depths from Levitus climatological data and photic depths computed from characteristic irradiance and
the archive of chlorophyll profiles discussed in Chapter 1.