

336
Chapter 11: The Pacific Ocean
changes in overall biomass have been observed but not fully understood. An excellent
example of the level of uncertainty is given by the analysis by Livingston et al. (1999) of
trends since the 1970s in three trophic guilds: consumers (i) of pelagic fish, (ii) of benthic
infauna, and (iii) of crabs and small fish. A number of case histories are examined to
determine causal relationships forced by changes in environmental factors and by the
fisheries: each analysis renders no better than further uncertainty. Is the long-term decline
of Pacific halibut due to a contemporary rise in temperature, or is it due to increase
in the pollack stocks and hence poor recruitment? Is the long-term decline in red king
crabs due to the contemporary increase of yellowfin sole, or to high discard mortalities
in the crab fishery? Those who believe that “ecosystem-based” fish stock management is
just around the corner would do well to examine the literature on such problems on the
east Bering Sea shelf, where analysis has been carried further than in most other major
fishery areas.
Synopsis
Case 1—Polar irradiance-mediated production peak, strongly modified by shallow-water
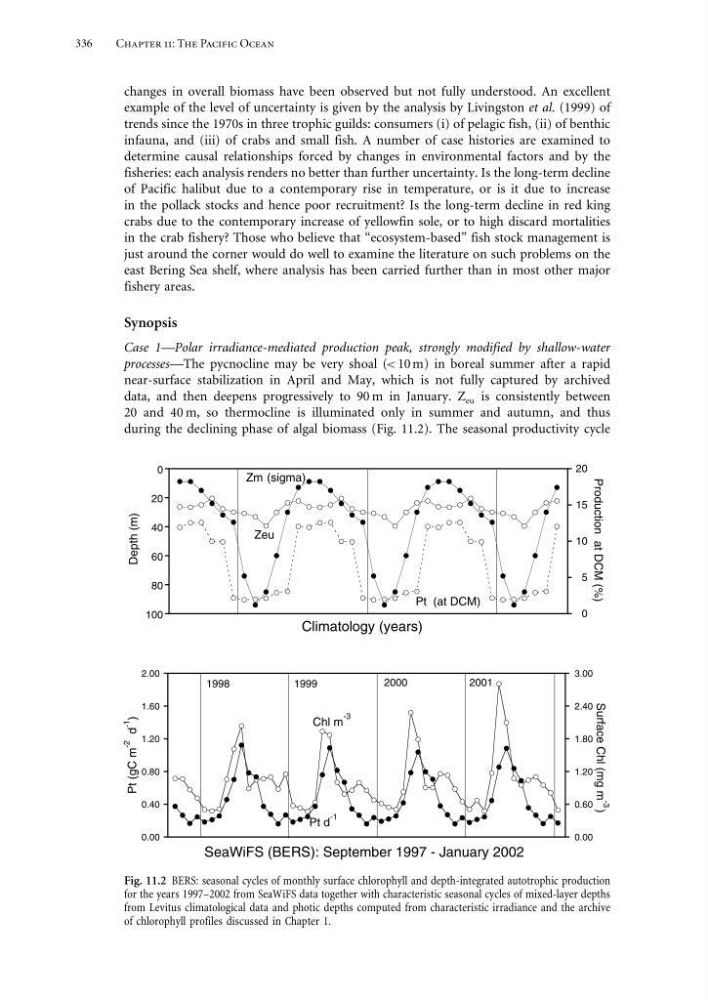
processes—The pycnocline may be very shoal (< 10 m) in boreal summer after a rapid
near-surface stabilization in April and May, which is not fully captured by archived
data, and then deepens progressively to 90 m in January. Z eu is consistently between
20 and 40 m, so thermocline is illuminated only in summer and autumn, and thus
during the declining phase of algal biomass (Fig. 11.2). The seasonal productivity cycle
0
20
40
60
80
100
0
5
10
15
20
Climatology (years)
Depth (m)
Production at DCM (%)
Zm (sigma)
Zeu
Pt (at DCM)
0.00
0.40
0.80
1.20
1.60
2.00
0.00
0.60
1.20
1.80
2.40
3.00
SeaWiFS (BERS): September 1997 - January 2002
Surface Chl (mg m -3
)
Pt (gC m
-2
d
-1
)
Pt d
-1
Chl m
-3
1998
1999
2000
2001
Fig. 11.2 BERS: seasonal cycles of monthly surface chlorophyll and depth-integrated autotrophic production
for the years 1997–2002 from SeaWiFS data together with characteristic seasonal cycles of mixed-layer depths
from Levitus climatological data and photic depths computed from characteristic irradiance and the archive
of chlorophyll profiles discussed in Chapter 1.
Chapter 11: The Pacific Ocean
changes in overall biomass have been observed but not fully understood. An excellent
example of the level of uncertainty is given by the analysis by Livingston et al. (1999) of
trends since the 1970s in three trophic guilds: consumers (i) of pelagic fish, (ii) of benthic
infauna, and (iii) of crabs and small fish. A number of case histories are examined to
determine causal relationships forced by changes in environmental factors and by the
fisheries: each analysis renders no better than further uncertainty. Is the long-term decline
of Pacific halibut due to a contemporary rise in temperature, or is it due to increase
in the pollack stocks and hence poor recruitment? Is the long-term decline in red king
crabs due to the contemporary increase of yellowfin sole, or to high discard mortalities
in the crab fishery? Those who believe that “ecosystem-based” fish stock management is
just around the corner would do well to examine the literature on such problems on the
east Bering Sea shelf, where analysis has been carried further than in most other major
fishery areas.
Synopsis
Case 1—Polar irradiance-mediated production peak, strongly modified by shallow-water
processes—The pycnocline may be very shoal (< 10 m) in boreal summer after a rapid
near-surface stabilization in April and May, which is not fully captured by archived
data, and then deepens progressively to 90 m in January. Z eu is consistently between
20 and 40 m, so thermocline is illuminated only in summer and autumn, and thus
during the declining phase of algal biomass (Fig. 11.2). The seasonal productivity cycle
0
20
40
60
80
100
0
5
10
15
20
Climatology (years)
Depth (m)
Production at DCM (%)
Zm (sigma)
Zeu
Pt (at DCM)
0.00
0.40
0.80
1.20
1.60
2.00
0.00
0.60
1.20
1.80
2.40
3.00
SeaWiFS (BERS): September 1997 - January 2002
Surface Chl (mg m -3
)
Pt (gC m
-2
d
-1
)
Pt d
-1
Chl m
-3
1998
1999
2000
2001
Fig. 11.2 BERS: seasonal cycles of monthly surface chlorophyll and depth-integrated autotrophic production
for the years 1997–2002 from SeaWiFS data together with characteristic seasonal cycles of mixed-layer depths
from Levitus climatological data and photic depths computed from characteristic irradiance and the archive
of chlorophyll profiles discussed in Chapter 1.