

Indian Ocean Trade Wind Biome
285
0.25
0.30
0.35
0.40
0.45
0.50
0.10
0.15
0.20
0.25
0.30
0.35
SeaWiFS (MONS): September 1997 - January 2002
Surface Chl (mg m -3
)
Pt d
-1
Chl m
-3
Pt (gC m
-2
d
-1
)
1998
1999
2000
2001
0
20
40
60
80
100
0
5
10
15
20
25
Climatology (years)
Depth (m)
Production at DCM (%)
Zm (sigma)
Zeu
Pt (at DCM)
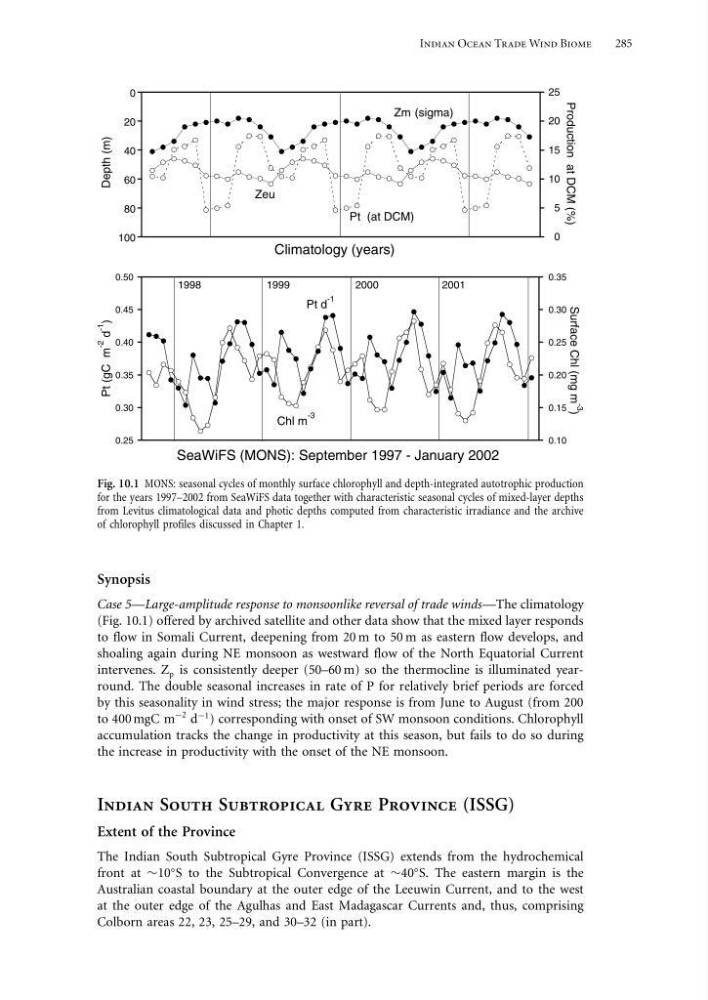
Fig. 10.1 MONS: seasonal cycles of monthly surface chlorophyll and depth-integrated autotrophic production
for the years 1997–2002 from SeaWiFS data together with characteristic seasonal cycles of mixed-layer depths
from Levitus climatological data and photic depths computed from characteristic irradiance and the archive
of chlorophyll profiles discussed in Chapter 1.
Synopsis
Case 5—Large-amplitude response to monsoonlike reversal of trade winds—The climatology
(Fig. 10.1) offered by archived satellite and other data show that the mixed layer responds
to flow in Somali Current, deepening from 20 m to 50 m as eastern flow develops, and
shoaling again during NE monsoon as westward flow of the North Equatorial Current
intervenes. Z p is consistently deeper (50–60 m) so the thermocline is illuminated yearround. The double seasonal increases in rate of P for relatively brief periods are forced
by this seasonality in wind stress; the major response is from June to August (from 200
to 400 mgC m
−2 d
−1 ) corresponding with onset of SW monsoon conditions. Chlorophyll
accumulation tracks the change in productivity at this season, but fails to do so during
the increase in productivity with the onset of the NE monsoon.
Indian South Subtropical Gyre Province (ISSG)
Extent of the Province
The Indian South Subtropical Gyre Province (ISSG) extends from the hydrochemical
front at ∼10
S to the Subtropical Convergence at ∼40
S. The eastern margin is the
Australian coastal boundary at the outer edge of the Leeuwin Current, and to the west
at the outer edge of the Agulhas and East Madagascar Currents and, thus, comprising
Colborn areas 22, 23, 25–29, and 30–32 (in part).
285
0.25
0.30
0.35
0.40
0.45
0.50
0.10
0.15
0.20
0.25
0.30
0.35
SeaWiFS (MONS): September 1997 - January 2002
Surface Chl (mg m -3
)
Pt d
-1
Chl m
-3
Pt (gC m
-2
d
-1
)
1998
1999
2000
2001
0
20
40
60
80
100
0
5
10
15
20
25
Climatology (years)
Depth (m)
Production at DCM (%)
Zm (sigma)
Zeu
Pt (at DCM)
Fig. 10.1 MONS: seasonal cycles of monthly surface chlorophyll and depth-integrated autotrophic production
for the years 1997–2002 from SeaWiFS data together with characteristic seasonal cycles of mixed-layer depths
from Levitus climatological data and photic depths computed from characteristic irradiance and the archive
of chlorophyll profiles discussed in Chapter 1.
Synopsis
Case 5—Large-amplitude response to monsoonlike reversal of trade winds—The climatology
(Fig. 10.1) offered by archived satellite and other data show that the mixed layer responds
to flow in Somali Current, deepening from 20 m to 50 m as eastern flow develops, and
shoaling again during NE monsoon as westward flow of the North Equatorial Current
intervenes. Z p is consistently deeper (50–60 m) so the thermocline is illuminated yearround. The double seasonal increases in rate of P for relatively brief periods are forced
by this seasonality in wind stress; the major response is from June to August (from 200
to 400 mgC m
−2 d
−1 ) corresponding with onset of SW monsoon conditions. Chlorophyll
accumulation tracks the change in productivity at this season, but fails to do so during
the increase in productivity with the onset of the NE monsoon.
Indian South Subtropical Gyre Province (ISSG)
Extent of the Province
The Indian South Subtropical Gyre Province (ISSG) extends from the hydrochemical
front at ∼10
S to the Subtropical Convergence at ∼40
S. The eastern margin is the
Australian coastal boundary at the outer edge of the Leeuwin Current, and to the west
at the outer edge of the Agulhas and East Madagascar Currents and, thus, comprising
Colborn areas 22, 23, 25–29, and 30–32 (in part).