

208
Chapter 9: The Atlantic Ocean
0.30
0.40
0.50
0.60
0.70
0.00
0.16
0.32
0.48
0.64
0.80
SeaWiFS (ETRA): September 1997 - January 2002
Surface Chl (mg m -3
)
Pt d
-1
Chl m
-3
1998
1999
2000
2001
Pt (gC m
-2
d
-1
)
0
20
40
60
80
100
0
5
10
15
20
Climatology (years)
Depth (m)
Production at DCM (%)
Zm (sigma)
Zeu
Pt (at DCM)
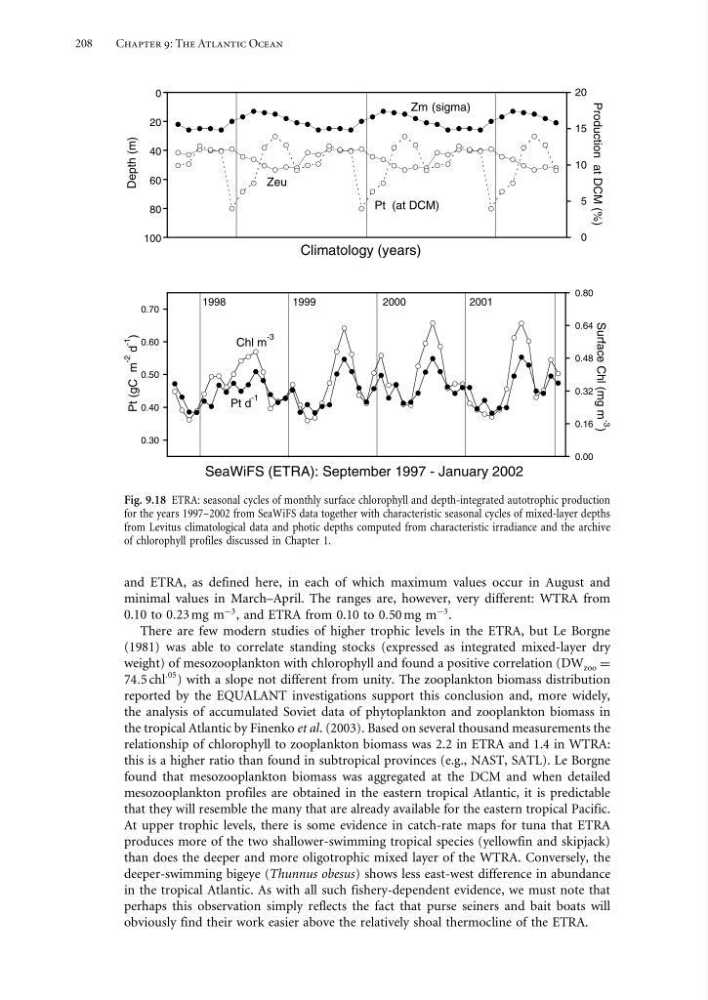
Fig. 9.18 ETRA: seasonal cycles of monthly surface chlorophyll and depth-integrated autotrophic production
for the years 1997–2002 from SeaWiFS data together with characteristic seasonal cycles of mixed-layer depths
from Levitus climatological data and photic depths computed from characteristic irradiance and the archive
of chlorophyll profiles discussed in Chapter 1.
and ETRA, as defined here, in each of which maximum values occur in August and
minimal values in March–April. The ranges are, however, very different: WTRA from
0.10 to 023 mg m
−3 , and ETRA from 0.10 to 050 mg m
−3 .
There are few modern studies of higher trophic levels in the ETRA, but Le Borgne
(1981) was able to correlate standing stocks (expressed as integrated mixed-layer dry
weight) of mesozooplankton with chlorophyll and found a positive correlation (DW zoo =
745 chl
05 ) with a slope not different from unity. The zooplankton biomass distribution
reported by the EQUALANT investigations support this conclusion and, more widely,
the analysis of accumulated Soviet data of phytoplankton and zooplankton biomass in
the tropical Atlantic by Finenko et al. (2003). Based on several thousand measurements the
relationship of chlorophyll to zooplankton biomass was 2.2 in ETRA and 1.4 in WTRA:
this is a higher ratio than found in subtropical provinces (e.g., NAST, SATL). Le Borgne
found that mesozooplankton biomass was aggregated at the DCM and when detailed
mesozooplankton profiles are obtained in the eastern tropical Atlantic, it is predictable
that they will resemble the many that are already available for the eastern tropical Pacific.
At upper trophic levels, there is some evidence in catch-rate maps for tuna that ETRA
produces more of the two shallower-swimming tropical species (yellowfin and skipjack)
than does the deeper and more oligotrophic mixed layer of the WTRA. Conversely, the
deeper-swimming bigeye (Thunnus obesus) shows less east-west difference in abundance
in the tropical Atlantic. As with all such fishery-dependent evidence, we must note that
perhaps this observation simply reflects the fact that purse seiners and bait boats will
obviously find their work easier above the relatively shoal thermocline of the ETRA.
Chapter 9: The Atlantic Ocean
0.30
0.40
0.50
0.60
0.70
0.00
0.16
0.32
0.48
0.64
0.80
SeaWiFS (ETRA): September 1997 - January 2002
Surface Chl (mg m -3
)
Pt d
-1
Chl m
-3
1998
1999
2000
2001
Pt (gC m
-2
d
-1
)
0
20
40
60
80
100
0
5
10
15
20
Climatology (years)
Depth (m)
Production at DCM (%)
Zm (sigma)
Zeu
Pt (at DCM)
Fig. 9.18 ETRA: seasonal cycles of monthly surface chlorophyll and depth-integrated autotrophic production
for the years 1997–2002 from SeaWiFS data together with characteristic seasonal cycles of mixed-layer depths
from Levitus climatological data and photic depths computed from characteristic irradiance and the archive
of chlorophyll profiles discussed in Chapter 1.
and ETRA, as defined here, in each of which maximum values occur in August and
minimal values in March–April. The ranges are, however, very different: WTRA from
0.10 to 023 mg m
−3 , and ETRA from 0.10 to 050 mg m
−3 .
There are few modern studies of higher trophic levels in the ETRA, but Le Borgne
(1981) was able to correlate standing stocks (expressed as integrated mixed-layer dry
weight) of mesozooplankton with chlorophyll and found a positive correlation (DW zoo =
745 chl
05 ) with a slope not different from unity. The zooplankton biomass distribution
reported by the EQUALANT investigations support this conclusion and, more widely,
the analysis of accumulated Soviet data of phytoplankton and zooplankton biomass in
the tropical Atlantic by Finenko et al. (2003). Based on several thousand measurements the
relationship of chlorophyll to zooplankton biomass was 2.2 in ETRA and 1.4 in WTRA:
this is a higher ratio than found in subtropical provinces (e.g., NAST, SATL). Le Borgne
found that mesozooplankton biomass was aggregated at the DCM and when detailed
mesozooplankton profiles are obtained in the eastern tropical Atlantic, it is predictable
that they will resemble the many that are already available for the eastern tropical Pacific.
At upper trophic levels, there is some evidence in catch-rate maps for tuna that ETRA
produces more of the two shallower-swimming tropical species (yellowfin and skipjack)
than does the deeper and more oligotrophic mixed layer of the WTRA. Conversely, the
deeper-swimming bigeye (Thunnus obesus) shows less east-west difference in abundance
in the tropical Atlantic. As with all such fishery-dependent evidence, we must note that
perhaps this observation simply reflects the fact that purse seiners and bait boats will
obviously find their work easier above the relatively shoal thermocline of the ETRA.