

200
Chapter 9: The Atlantic Ocean
EQUALANT data demonstrate a band of high zooplankton biomass from 5
N to 5
S,
with patches of higher values right at the equator. The basin-scale model of Wroblewski
et al. (1988) predicts relatively high zooplankton biomass in the NECC/Guinea Dome
region.
It is no surprise, therefore to find in the Fontenau tuna atlas that the NECC is a favored
location, especially in the third quarter of the year, for the tuna long-line fishery. The
absence of fishing effort along the equatorial divergence is perhaps due to the difficulty
of working long-line gear in an area of such strong vertical current shear.
Synopsis
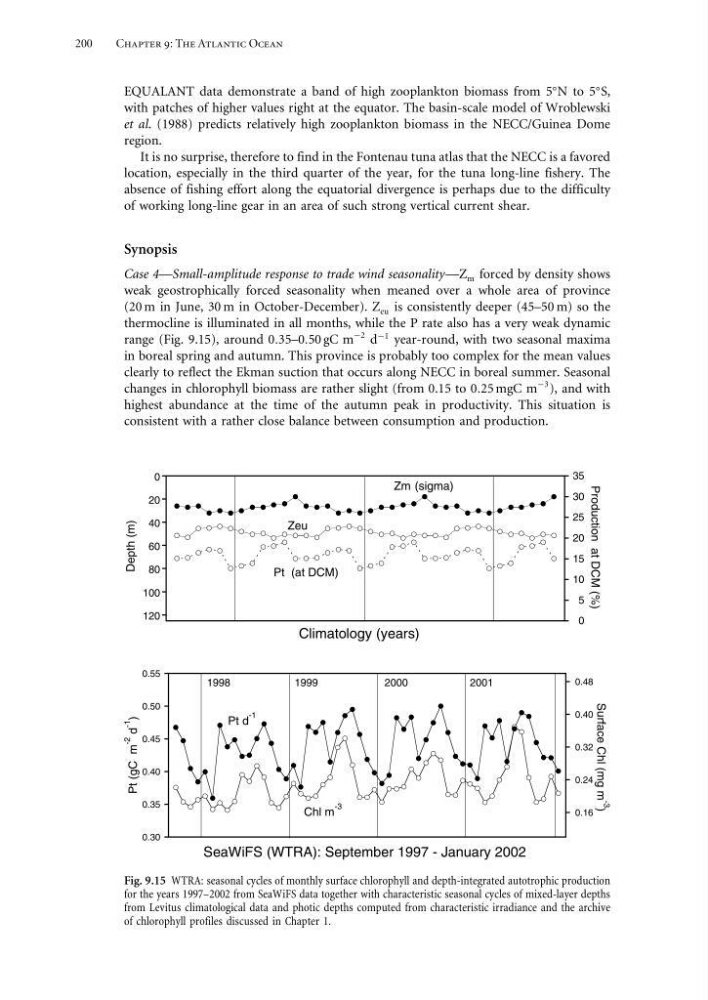
Case 4—Small-amplitude response to trade wind seasonality—Z m forced by density shows
weak geostrophically forced seasonality when meaned over a whole area of province
(20 m in June, 30 m in October-December). Z eu is consistently deeper (45–50 m) so the
thermocline is illuminated in all months, while the P rate also has a very weak dynamic
range (Fig. 9.15), around 035–050 gC m
−2 d
−1 year-round, with two seasonal maxima
in boreal spring and autumn. This province is probably too complex for the mean values
clearly to reflect the Ekman suction that occurs along NECC in boreal summer. Seasonal
changes in chlorophyll biomass are rather slight (from 0.15 to 025 mgC m
−3 ), and with
highest abundance at the time of the autumn peak in productivity. This situation is
consistent with a rather close balance between consumption and production.
0.30
0.35
0.40
0.45
0.50
0.55
0.16
0.24
0.32
0.40
0.48
SeaWiFS (WTRA): September 1997 - January 2002
Surface Chl (mg m -3
)
Pt d
-1
Chl m
-3
Pt (gC m
-2
d
-1
)
1998
1999
2000
2001
0
20
40
60
80
100
120
0
5
10
15
20
25
30
35
Climatology (years)
Depth (m)
Production at DCM (%)
Zm (sigma)
Zeu
Pt (at DCM)
Fig. 9.15 WTRA: seasonal cycles of monthly surface chlorophyll and depth-integrated autotrophic production
for the years 1997–2002 from SeaWiFS data together with characteristic seasonal cycles of mixed-layer depths
from Levitus climatological data and photic depths computed from characteristic irradiance and the archive
of chlorophyll profiles discussed in Chapter 1.
Chapter 9: The Atlantic Ocean
EQUALANT data demonstrate a band of high zooplankton biomass from 5
N to 5
S,
with patches of higher values right at the equator. The basin-scale model of Wroblewski
et al. (1988) predicts relatively high zooplankton biomass in the NECC/Guinea Dome
region.
It is no surprise, therefore to find in the Fontenau tuna atlas that the NECC is a favored
location, especially in the third quarter of the year, for the tuna long-line fishery. The
absence of fishing effort along the equatorial divergence is perhaps due to the difficulty
of working long-line gear in an area of such strong vertical current shear.
Synopsis
Case 4—Small-amplitude response to trade wind seasonality—Z m forced by density shows
weak geostrophically forced seasonality when meaned over a whole area of province
(20 m in June, 30 m in October-December). Z eu is consistently deeper (45–50 m) so the
thermocline is illuminated in all months, while the P rate also has a very weak dynamic
range (Fig. 9.15), around 035–050 gC m
−2 d
−1 year-round, with two seasonal maxima
in boreal spring and autumn. This province is probably too complex for the mean values
clearly to reflect the Ekman suction that occurs along NECC in boreal summer. Seasonal
changes in chlorophyll biomass are rather slight (from 0.15 to 025 mgC m
−3 ), and with
highest abundance at the time of the autumn peak in productivity. This situation is
consistent with a rather close balance between consumption and production.
0.30
0.35
0.40
0.45
0.50
0.55
0.16
0.24
0.32
0.40
0.48
SeaWiFS (WTRA): September 1997 - January 2002
Surface Chl (mg m -3
)
Pt d
-1
Chl m
-3
Pt (gC m
-2
d
-1
)
1998
1999
2000
2001
0
20
40
60
80
100
120
0
5
10
15
20
25
30
35
Climatology (years)
Depth (m)
Production at DCM (%)
Zm (sigma)
Zeu
Pt (at DCM)
Fig. 9.15 WTRA: seasonal cycles of monthly surface chlorophyll and depth-integrated autotrophic production
for the years 1997–2002 from SeaWiFS data together with characteristic seasonal cycles of mixed-layer depths
from Levitus climatological data and photic depths computed from characteristic irradiance and the archive
of chlorophyll profiles discussed in Chapter 1.