

154
Chapter 9: The Atlantic Ocean
Herring, of course, are not the only predators of Calanus: during the winter, and
during their rise in spring, Calanus encounter mesopelagic fish (e.g., Benthosema glaciale)
together with blue whiting, and these predators probably account for much of the
significant biomass loss suffered by the overwintering population. Kaartvedt (op. cit.)
suggests that the seasonal vertical migration pattern of Calanus removes the vulnerable
late copepodites into a deep sanctuary, but this is a difficult thesis to prove. It is at
least as likely that the colder water in which the copepods overwinter is selected for its
temperature regime, conducive to physiological stasis.
The balance between stock biomass of zooplankton and fish is dynamic and mutually
varying. The stock biomass of capelin in the Barents Sea since the mid-1970s has varied
from <05 to 7–8 million tons over quite short periods (Gjosaeter et al., 2002); recruitment
failure of capelin, as occurred in 1983 and 1991, is attributed to consumption of capelin
larvae by herring stocks, themselves at peak abundance in these years. After the 1991
population crash of capelin, the biomass of zooplankton in the Barents Sea more than
doubled, from about 5 to about 14 g m
−2 . Biomass of euphausiids (Thysanoessa spp.) is
also inversely related to capelin biomass in the Barents Sea. Similar trophic dynamics link
cod biomass to the relative abundance of components of the pelagic ecosystem. After
a juvenile period when the codling feed largely on benthic hard-ground invertebrates,
growing cod have a very catholic diet, taken largely from the pelagos. In periods when
capelin biomass is low, as in 1991–94, the level of cannibalism increases significantly
while polar cod, herring, and amphipods are more dominant in cod diet than at other
times. During these years, the cod growth rate declines and appears to be dependent on
capelin abundance. Also in such years, nesting success is low in surface-feeding sea birds,
such as fulmar and kittiwake. Nor should we forget that krill and clupeid fish (capelin,
herring) are consumed in very large quantities by baleen whales, representing transfer to
the highest trophic levels along notably short food chains.
It is, of course, herring (Clupea harengus) that are most associated in our minds with
the SARC province, because this is the home of the highly variable Atlanto-Scandian
stock that performs extensive migrations each year throughout the Norwegian Sea. This
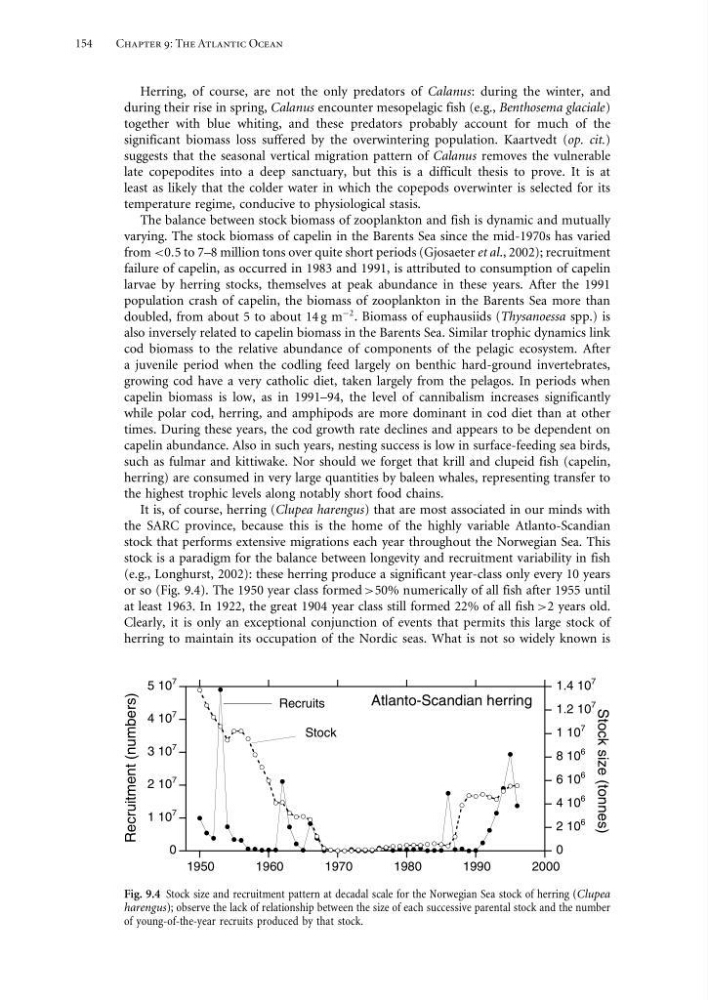
stock is a paradigm for the balance between longevity and recruitment variability in fish
(e.g., Longhurst, 2002): these herring produce a significant year-class only every 10 years
or so (Fig. 9.4). The 1950 year class formed >50% numerically of all fish after 1955 until
at least 1963. In 1922, the great 1904 year class still formed 22% of all fish >2 years old.
Clearly, it is only an exceptional conjunction of events that permits this large stock of
herring to maintain its occupation of the Nordic seas. What is not so widely known is
0
1 10
7
2 10
7
3 10
7
4 10
7
5 10
7
0
2 10
6
4 10
6
6 10
6
8 10
6
1 10
7
1.2 10
7
1.4 10
7
1950
1960
1970
1980
1990
2000
Recruitment (numbers)
Stock size (tonnes)
Recruits
Stock
Atlanto-Scandian herring
Fig. 9.4 Stock size and recruitment pattern at decadal scale for the Norwegian Sea stock of herring (Clupea
harengus); observe the lack of relationship between the size of each successive parental stock and the number
of young-of-the-year recruits produced by that stock.
Chapter 9: The Atlantic Ocean
Herring, of course, are not the only predators of Calanus: during the winter, and
during their rise in spring, Calanus encounter mesopelagic fish (e.g., Benthosema glaciale)
together with blue whiting, and these predators probably account for much of the
significant biomass loss suffered by the overwintering population. Kaartvedt (op. cit.)
suggests that the seasonal vertical migration pattern of Calanus removes the vulnerable
late copepodites into a deep sanctuary, but this is a difficult thesis to prove. It is at
least as likely that the colder water in which the copepods overwinter is selected for its
temperature regime, conducive to physiological stasis.
The balance between stock biomass of zooplankton and fish is dynamic and mutually
varying. The stock biomass of capelin in the Barents Sea since the mid-1970s has varied
from <05 to 7–8 million tons over quite short periods (Gjosaeter et al., 2002); recruitment
failure of capelin, as occurred in 1983 and 1991, is attributed to consumption of capelin
larvae by herring stocks, themselves at peak abundance in these years. After the 1991
population crash of capelin, the biomass of zooplankton in the Barents Sea more than
doubled, from about 5 to about 14 g m
−2 . Biomass of euphausiids (Thysanoessa spp.) is
also inversely related to capelin biomass in the Barents Sea. Similar trophic dynamics link
cod biomass to the relative abundance of components of the pelagic ecosystem. After
a juvenile period when the codling feed largely on benthic hard-ground invertebrates,
growing cod have a very catholic diet, taken largely from the pelagos. In periods when
capelin biomass is low, as in 1991–94, the level of cannibalism increases significantly
while polar cod, herring, and amphipods are more dominant in cod diet than at other
times. During these years, the cod growth rate declines and appears to be dependent on
capelin abundance. Also in such years, nesting success is low in surface-feeding sea birds,
such as fulmar and kittiwake. Nor should we forget that krill and clupeid fish (capelin,
herring) are consumed in very large quantities by baleen whales, representing transfer to
the highest trophic levels along notably short food chains.
It is, of course, herring (Clupea harengus) that are most associated in our minds with
the SARC province, because this is the home of the highly variable Atlanto-Scandian
stock that performs extensive migrations each year throughout the Norwegian Sea. This
stock is a paradigm for the balance between longevity and recruitment variability in fish
(e.g., Longhurst, 2002): these herring produce a significant year-class only every 10 years
or so (Fig. 9.4). The 1950 year class formed >50% numerically of all fish after 1955 until
at least 1963. In 1922, the great 1904 year class still formed 22% of all fish >2 years old.
Clearly, it is only an exceptional conjunction of events that permits this large stock of
herring to maintain its occupation of the Nordic seas. What is not so widely known is
0
1 10
7
2 10
7
3 10
7
4 10
7
5 10
7
0
2 10
6
4 10
6
6 10
6
8 10
6
1 10
7
1.2 10
7
1.4 10
7
1950
1960
1970
1980
1990
2000
Recruitment (numbers)
Stock size (tonnes)
Recruits
Stock
Atlanto-Scandian herring
Fig. 9.4 Stock size and recruitment pattern at decadal scale for the Norwegian Sea stock of herring (Clupea
harengus); observe the lack of relationship between the size of each successive parental stock and the number
of young-of-the-year recruits produced by that stock.