

Ecological Provinces in the Open Ocean
109
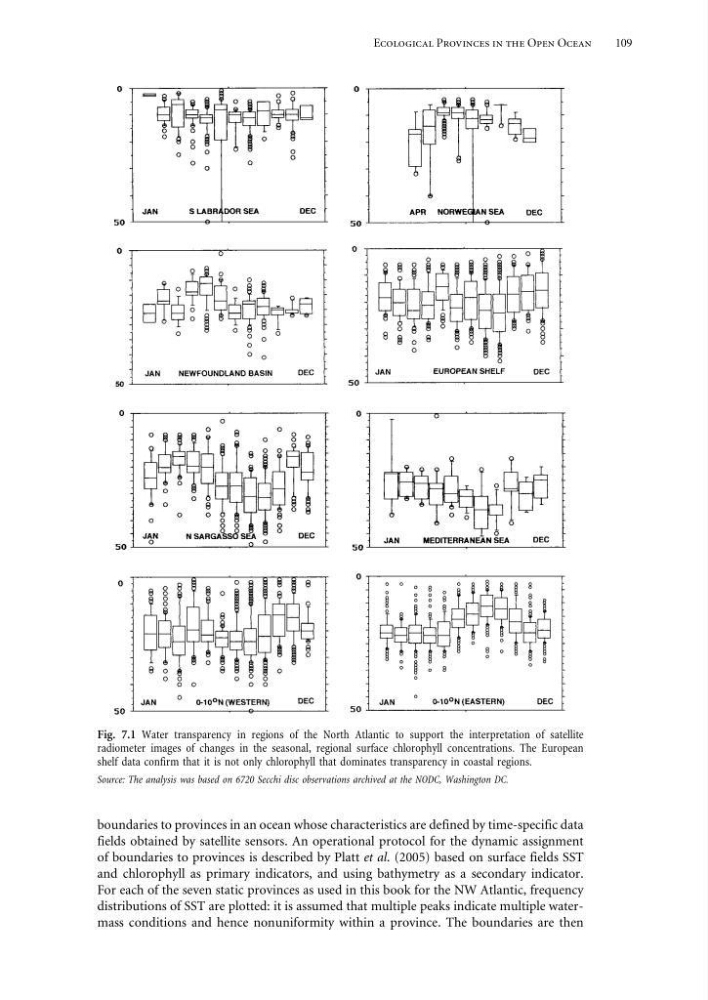
Fig. 7.1 Water transparency in regions of the North Atlantic to support the interpretation of satellite
radiometer images of changes in the seasonal, regional surface chlorophyll concentrations. The European
shelf data confirm that it is not only chlorophyll that dominates transparency in coastal regions.
Source: The analysis was based on 6720 Secchi disc observations archived at the NODC, Washington DC.
boundaries to provinces in an ocean whose characteristics are defined by time-specific data
fields obtained by satellite sensors. An operational protocol for the dynamic assignment
of boundaries to provinces is described by Platt et al. (2005) based on surface fields SST
and chlorophyll as primary indicators, and using bathymetry as a secondary indicator.
For each of the seven static provinces as used in this book for the NW Atlantic, frequency
distributions of SST are plotted: it is assumed that multiple peaks indicate multiple watermass conditions and hence nonuniformity within a province. The boundaries are then
109
Fig. 7.1 Water transparency in regions of the North Atlantic to support the interpretation of satellite
radiometer images of changes in the seasonal, regional surface chlorophyll concentrations. The European
shelf data confirm that it is not only chlorophyll that dominates transparency in coastal regions.
Source: The analysis was based on 6720 Secchi disc observations archived at the NODC, Washington DC.
boundaries to provinces in an ocean whose characteristics are defined by time-specific data
fields obtained by satellite sensors. An operational protocol for the dynamic assignment
of boundaries to provinces is described by Platt et al. (2005) based on surface fields SST
and chlorophyll as primary indicators, and using bathymetry as a secondary indicator.
For each of the seven static provinces as used in this book for the NW Atlantic, frequency
distributions of SST are plotted: it is assumed that multiple peaks indicate multiple watermass conditions and hence nonuniformity within a province. The boundaries are then