

26
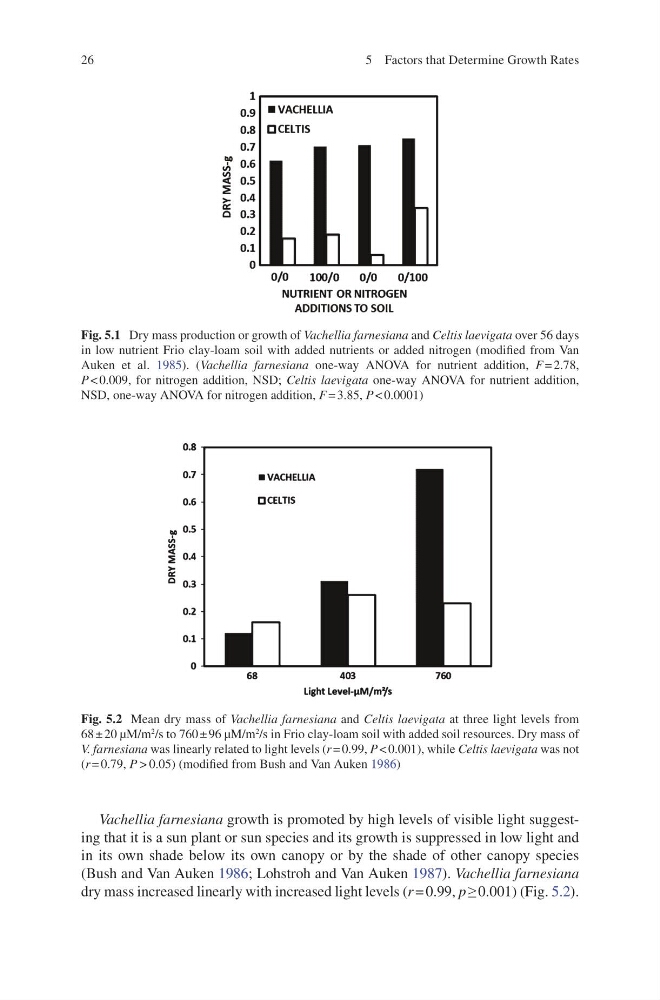
Vachellia farnesiana growth is promoted by high levels of visible light suggesting that it is a sun plant or sun species and its growth is suppressed in low light and
in its own shade below its own canopy or by the shade of other canopy species
(Bush and Van Auken 1986 ; Lohstroh and Van Auken 1987 ). Vachellia farnesiana
dry mass increased linearly with increased light levels ( r = 0.99, p ≥ 0.001) (Fig. 5.2 ).
Fig. 5.1 Dry mass production or growth of Vachellia farnesiana and Celtis laevigata over 56 days
in low nutrient Frio clay-loam soil with added nutrients or added nitrogen (modifi ed from Van
Auken et al. 1985 ). ( Vachellia farnesiana one-way ANOVA for nutrient addition, F = 2.78,
P < 0.009, for nitrogen addition, NSD; Celtis laevigata one-way ANOVA for nutrient addition,
NSD, one-way ANOVA for nitrogen addition, F = 3.85, P < 0.0001)
Fig. 5.2 Mean dry mass of Vachellia farnesiana and Celtis laevigata at three light levels from
68 ± 20 μM/m
2 /s to 760 ± 96 μM/m
2
/s in Frio clay-loam soil with added soil resources. Dry mass of
V. farnesiana was linearly related to light levels ( r = 0.99, P < 0.001), while Celtis laevigata was not
( r = 0.79, P > 0.05) (modifi ed from Bush and Van Auken 1986 )
5 Factors that Determine Growth Rates
Vachellia farnesiana growth is promoted by high levels of visible light suggesting that it is a sun plant or sun species and its growth is suppressed in low light and
in its own shade below its own canopy or by the shade of other canopy species
(Bush and Van Auken 1986 ; Lohstroh and Van Auken 1987 ). Vachellia farnesiana
dry mass increased linearly with increased light levels ( r = 0.99, p ≥ 0.001) (Fig. 5.2 ).
Fig. 5.1 Dry mass production or growth of Vachellia farnesiana and Celtis laevigata over 56 days
in low nutrient Frio clay-loam soil with added nutrients or added nitrogen (modifi ed from Van
Auken et al. 1985 ). ( Vachellia farnesiana one-way ANOVA for nutrient addition, F = 2.78,
P < 0.009, for nitrogen addition, NSD; Celtis laevigata one-way ANOVA for nutrient addition,
NSD, one-way ANOVA for nitrogen addition, F = 3.85, P < 0.0001)
Fig. 5.2 Mean dry mass of Vachellia farnesiana and Celtis laevigata at three light levels from
68 ± 20 μM/m
2 /s to 760 ± 96 μM/m
2
/s in Frio clay-loam soil with added soil resources. Dry mass of
V. farnesiana was linearly related to light levels ( r = 0.99, P < 0.001), while Celtis laevigata was not
( r = 0.79, P > 0.05) (modifi ed from Bush and Van Auken 1986 )
5 Factors that Determine Growth Rates